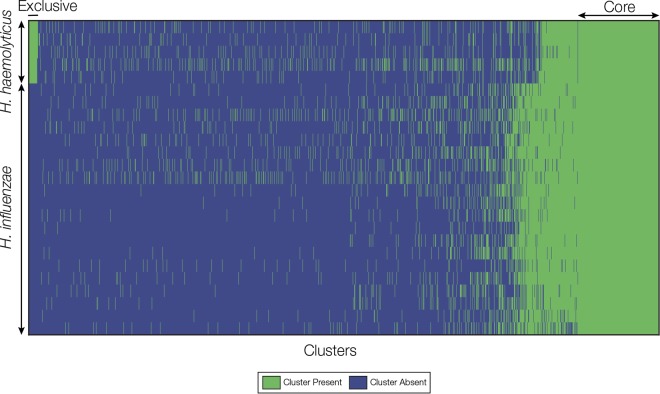
FIG 2.
Homologous gene cluster presence/absence matrix. Genomes are shown as rows, and homologous gene clusters are shown as columns. The presence of a gene cluster in a genome is indicated by green, and cluster absence is indicated by blue. H. haemolyticus genomes are shown on top of the matrix, and H. influenzae genomes are shown below. Core clusters found in all genomes are shown on the right of the matrix, and clusters exclusive to H. haemolyticus (i.e., potential RT-PCR targets) are shown in the upper left corner of the matrix.

