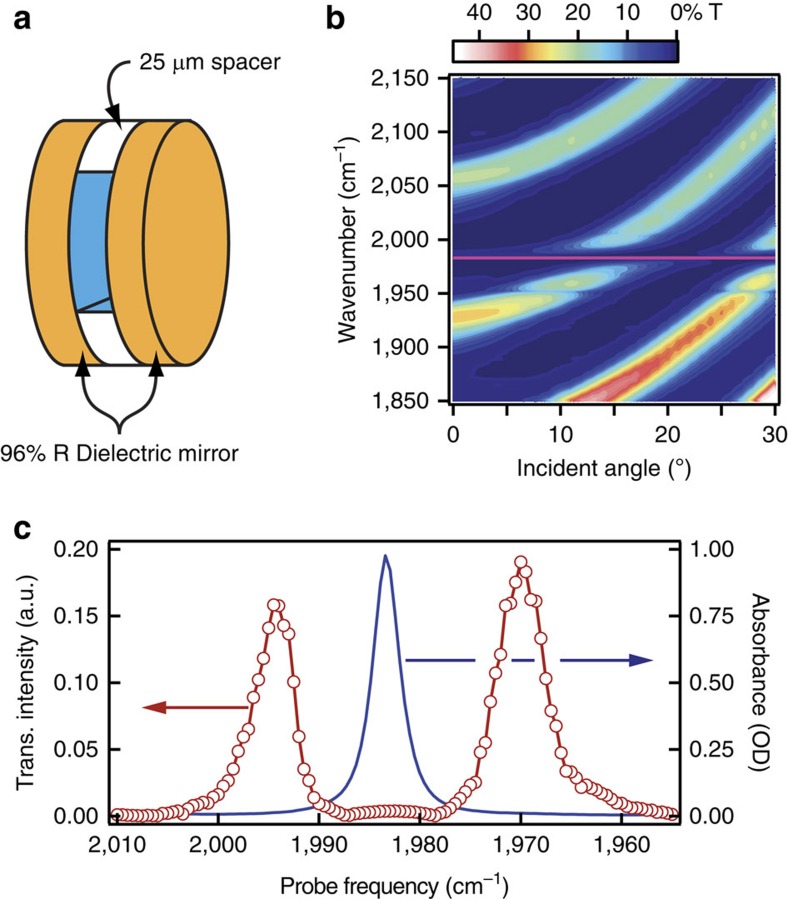
Figure 1. Experimental schematic and frequency-domain spectra.
(a) Schematic of sample comprising two dielectric mirrors separated by a PTFE spacer and filled with the solution of interest. (b) Dispersion of the infrared transmission of a cavity filled with 10 mM W(CO)6 in hexane. The pink line corresponds to the position of the infrared-active C–O stretch at 1,983 cm−1. (c) Red points are the measured intensity of the probe pulse transmitted through the cavity in b, showing the UP and LP bands separated by the effective splitting. Blue trace is the Fourier transform infrared spectrum of W(CO)6 without cavity coupling (5 mM solution in a 25 μm cell comprising CaF2 windows), dominated by the C–O stretch absorption at 1,983 cm−1.

