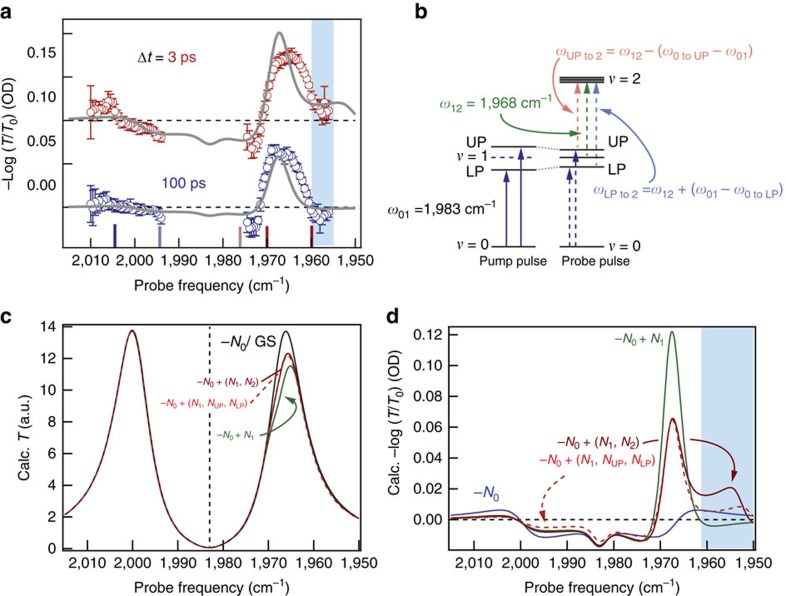
Figure 3. Transient spectroscopy of cavity-coupled W(CO)6.
(a) Transient spectra of cavity-coupled W(CO)6 (20 mM in hexane) measured 3 (red) and 100 ps (blue) after excitation. Open circles are measured−log10(T/T0) and error bars represent one s.d. obtained from 10 measurements at a given probe frequency. Solid grey lines are models detailed in the text. Traces are offset for clarity. Coloured vertical lines on the frequency axis correspond to probe frequencies presented in Fig. 4. The blue box highlights the low-frequency response that indicates UP population. (b) Schematic representation of energy levels and transitions involved in the cavity-coupled transient absorption experiment. The pump pulse excites the UP and LP levels. The probe pulse monitors the reduced splitting between UP and LP, as well as additional transitions from UP, LP and ν=1 to 2. The excited-state population is so low that the splitting in ν=2 is smaller than the absorption linewidth. (c) Calculated transmission spectra for varying amplitude (population) of oscillators at the frequencies described in b. The ground-state (black) curve has population only in ν=0 and is calculated for 20 mM W(CO)6. Other curves are calculated for a 1% reduction in population at ν=0 (labelled−N0) and commensurately increased population in other modes (for example, +N1 for increased population in ν=1). The calculated spectrum for a 1% depletion in ground-state population, −N0, is indistinguishable from the GS curve. (d) Calculated differential absorption spectra for the same population distributions used to calculate the spectra in c. Population in either ν=2 or UP and LP gives rise to qualitatively similar spectra. The blue box highlights the low-frequency response that indicates UP population.

