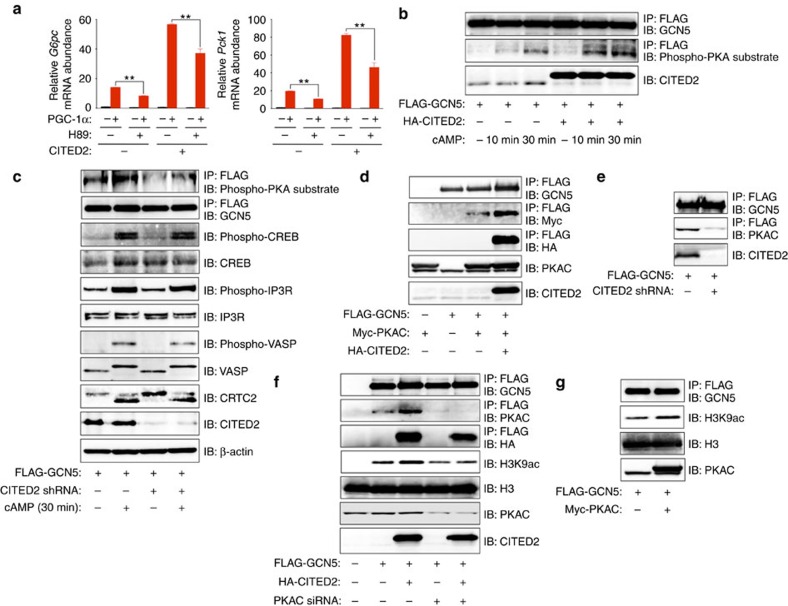
Figure 6. GCN5 is phosphorylated by PKA within a GCN5-CITED2-PKA signalling module.
(a) Effects of PKA inhibition with H89 (20 μM, 6 h) on gluconeogenic gene expression induced by overexpression of PGC-1α with or without CITED2 in primary hepatocytes. Data are means±s.e.m. (n=3). **P<0.01 (ANOVA with Bonferroni's post hoc test). (b) Immunoblot analysis of the effects of HA-CITED2 expression or pCPT-cAMP treatment (10 or 30 min) on phosphorylation of FLAG-GCN5 in AML12 cells as assessed with antibodies to phosphorylated PKA substrates. (c) Effects of CITED2 depletion on pCPT-cAMP-induced phosphorylation of FLAG-GCN5 and other PKA substrates as well as on the dephosphorylation of CRTC2 in primary hepatocytes. (d,e) IP and immunoblot analysis of the interaction of FLAG-GCN5 with Myc-PKAC and HA-CITED2 (d) as well as of the effect of CITED2 knockdown on the interaction of FLAG-GCN5 with PKAC (e) in AML12 cells. (f) Effect of siRNA-mediated PKAC depletion in AML12 cells on basal and CITED2-induced HAT activity of FLAG-GCN5 as assessed by in vitro assay. (g) Effect of PKAC overexpression in AML12 cells on HAT activity of FLAG-GCN5 measured in vitro. A Myc-PKAC plasmid and PKAC siRNA were introduced into cells by transfection, whereas adenoviral vectors were used to introduce other exogenous proteins or shRNAs in these experiments. Data are representative of at least three independent experiments. ANOVA, analysis of variance; siRNA; small interfering RNA.

