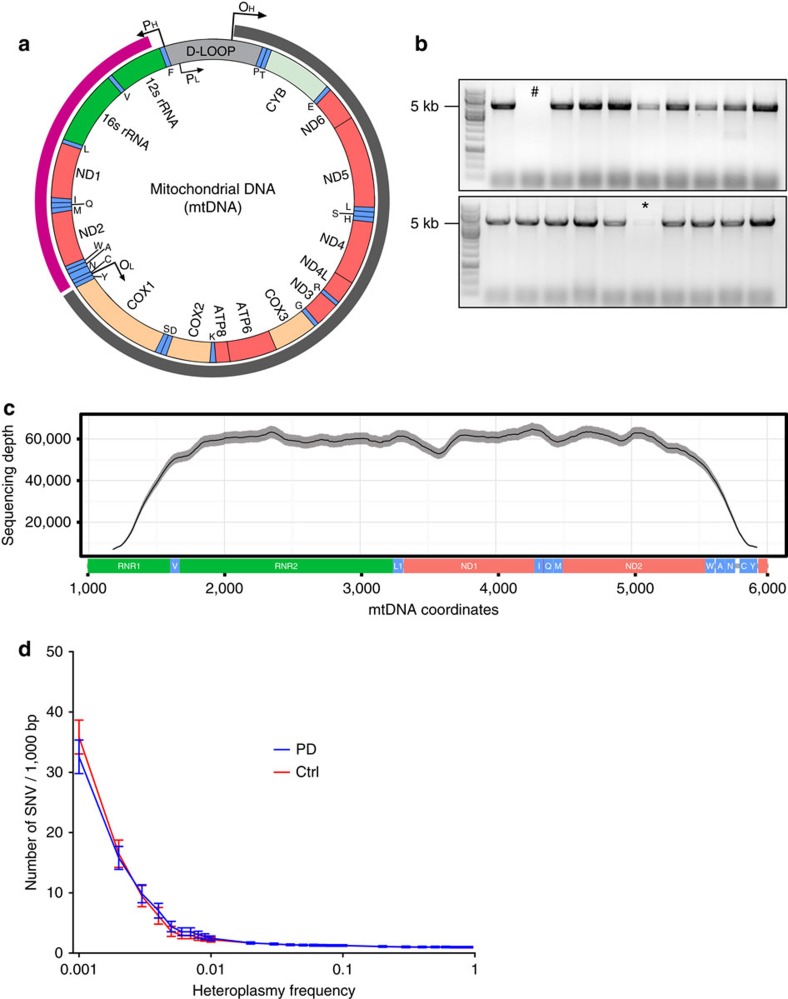
Figure 7. Amplification and deep-sequencing of mtDNA from single dopaminergic substantia nigra neurons of individuals with PD and controls.
(a) Schematic representation of human mtDNA, indicating the major arc (grey arc), where the vast majority of mtDNA deletions occur, and the position of the 4,767 bp fragment used for ultra-deep sequencing (magenta arc). mtDNA genes are coloured by type of transcript and designated by standard nomenclature. Genes encoding tRNAs are coloured green and designated by the one-letter code of their corresponding amino acid. (b) PCR products were amplified from single-cell lysates and analysed by agarose gel electrophoresis before sequencing. Samples with low (*) or no (#) amplification were omitted. (c) Mean sequencing depth and coverage of the mtDNA fragment after completed quality control. The solid black line shows the mean depth for all samples per mtDNA position and the shaded grey line corresponds to the 95% confidence interval (CI). Indicatively, 95% of the sequence was covered at >12,000 × depth and 80% at >50,000 × depth. (d) Total burden of mtDNA SNVs in single dopaminergic neurons of the substantia nigra plotted against the base 10 logarithm of heteroplasmy frequency (HF). Bars show 95% CIs. Point mtDNA variation is found at generally low levels in nigral neurons and the majority of variants cluster at heteroplasmic frequencies below 1%. There is no difference in point mutational burden between individuals with PD (blue) and controls (red).

