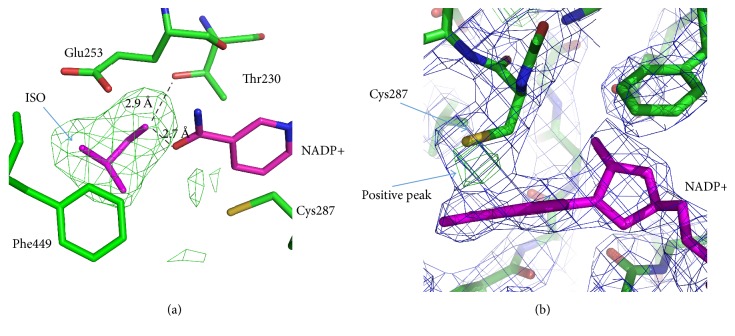
Figure 6.
Active site in the complex of AlDHPyr1147 with isobutyraldehyde (ISO) and NADP+. The active site residues are in green. NADP+ and isobutyraldehyde are in magenta. The 2F obs − F calc electron density map for the AlDHPyr1147 model is contoured at 1σ and colored blue. (a) The omit F obs − F calc electron density map for the model of the tertiary complex around the region of the substrate. The map is colored green and contoured at 3σ. (b) Positive electron density in the F obs − F calc electron density map for AlDHPyr1147, which is indicative of the possible second conformation of Cys287. The F obs − F calc electron density map for the AlDHPyr1147 model is contoured at +3.2σ and colored green. Hydrogen bonds are shown by dashed lines.

