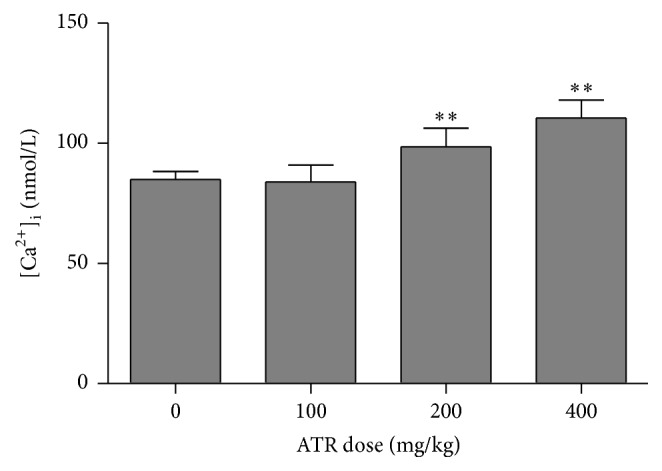
Figure 4.

Intracellular [Ca2+]i levels in splenocytes. Mice were exposed by daily oral gavage to ATR doses for 21 days. Cells were harvested 24 hr after the final dosing. Values shown are for means ± SE for five mice (males and females combined), analyzed individually. Value is significantly different from control (∗∗ p < 0.01).
