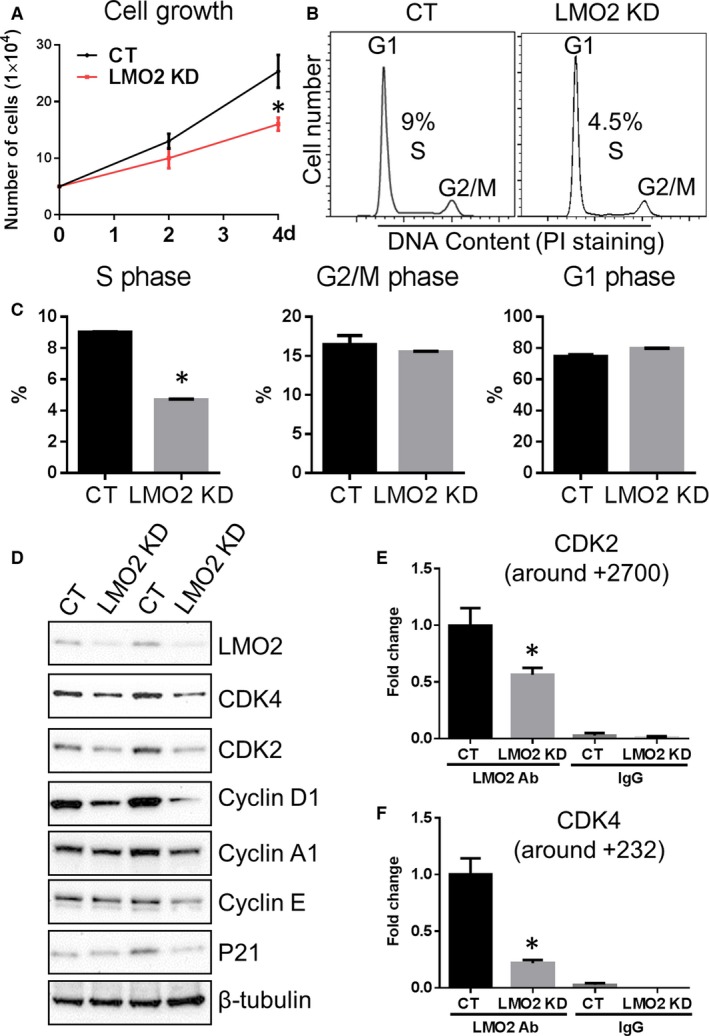
Figure 2.

LMO2 knockdown (KD) reduced cell proliferation and hindered G1/S transition. A, Cell growth curve. B, Cell cycle analysis by propidium iodide (PI) staining. C, Quantification of cell fractions in G1, S, and G2/M phases. D, Western blot examination of G1/S transition‐related genes. E and F, chromatin immunoprecipitation polymerase chain reaction analysis of LMO2 complex binding to CDK2 gene (+2700) and CDK4 gene (+232) in both control (CT) and LMO2 KD cells. Data are presented as mean±SEM (n=3). *P<0.05 vs CT.
