
Figure 3.
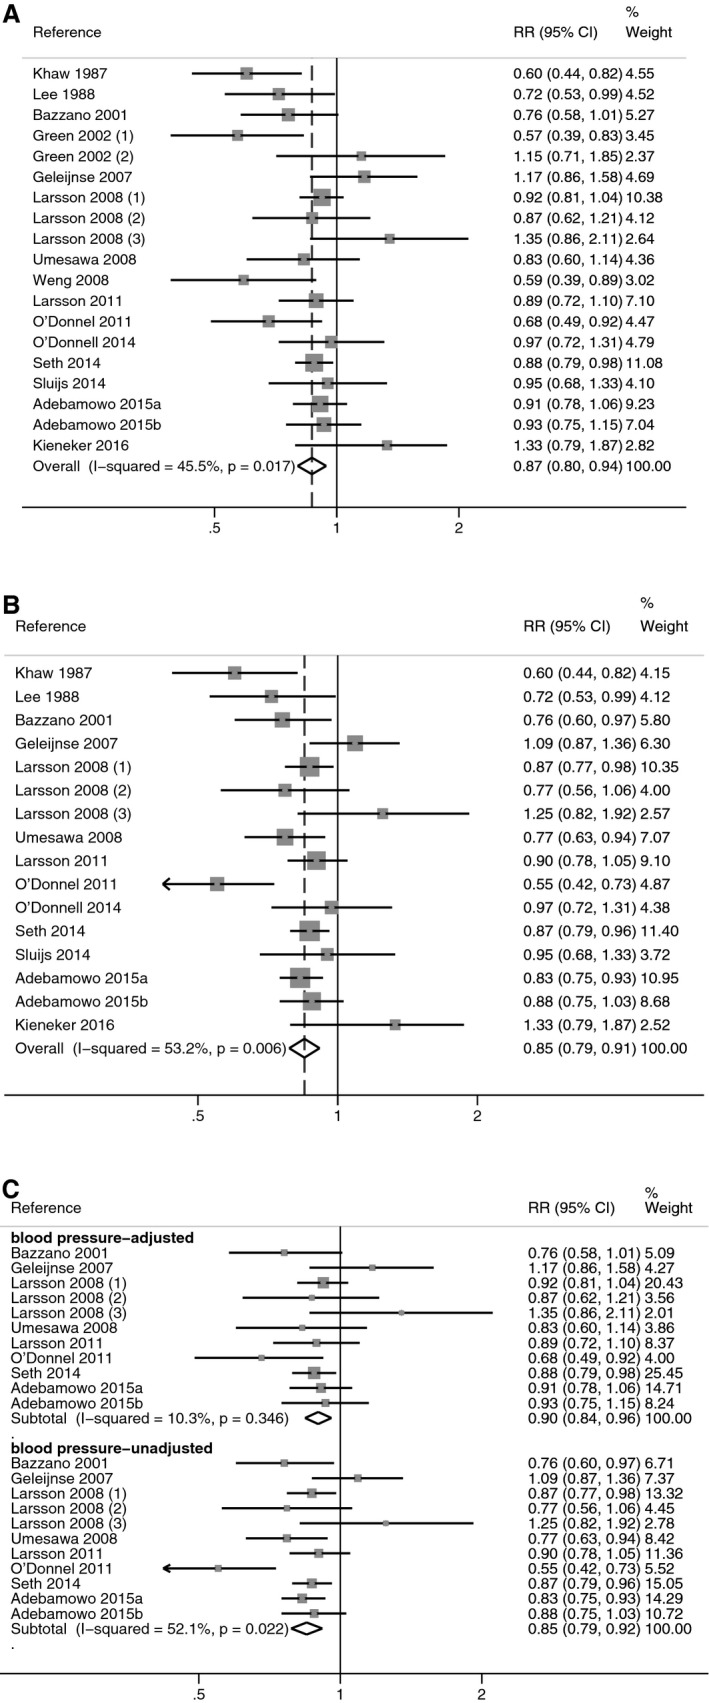
Meta‐analysis of the relative risk (RR), with 95% CI of stroke in observational cohort studies, according to the covariates included in multivariate modeling. RRs from all studies using the “most adjusted model” (A) and the “blood pressure–unadjusted model” (B), and from the studies reporting both blood pressure–adjusted and unadjusted estimates (C).