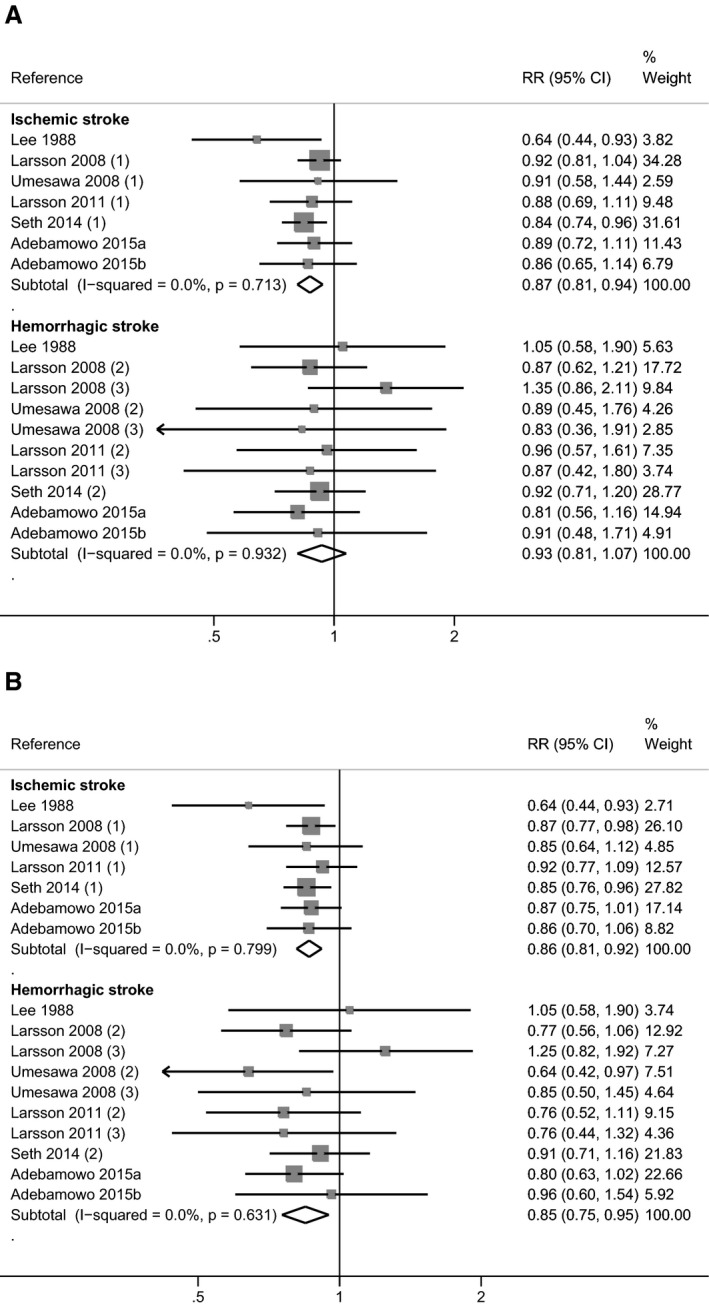
Figure 5.

Meta‐analysis of the relative risk (RR) with 95% CI of stroke in observational cohort studies according to stroke subtype (ischemic and hemorrhagic). Estimates are from the “most adjusted model” (A) and from the “blood pressure–unadjusted model” (B).
