
Figure 1.
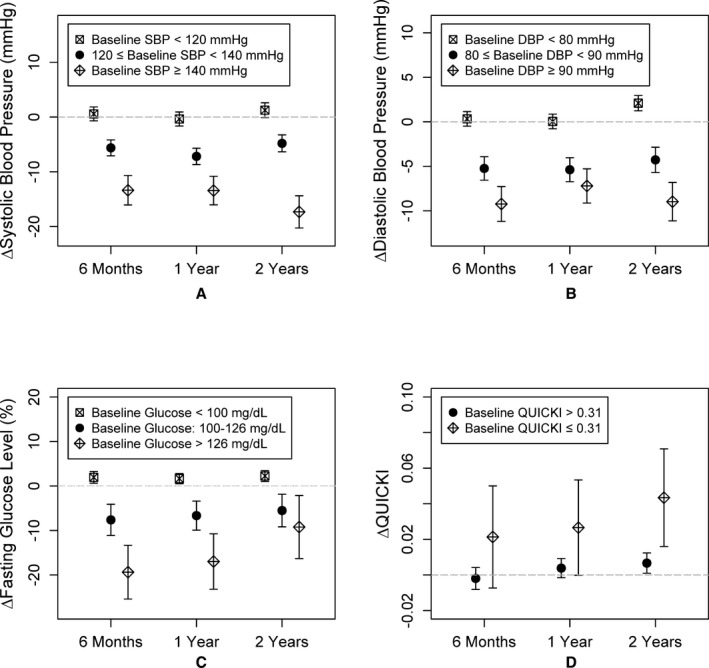
Change in (A) systolic blood pressure (mm Hg), (B) diastolic blood pressure (mm Hg), (C) fasting glucose (%), and (D) insulin sensitivity index (QUICKI) at 6 months, 1 year, and 2 years compared to the baseline visit. Mean changes and the corresponding 95% CIs at each visit for each subgroup are shown. DBP indicates diastolic blood pressure; SBP, systolic blood pressure.