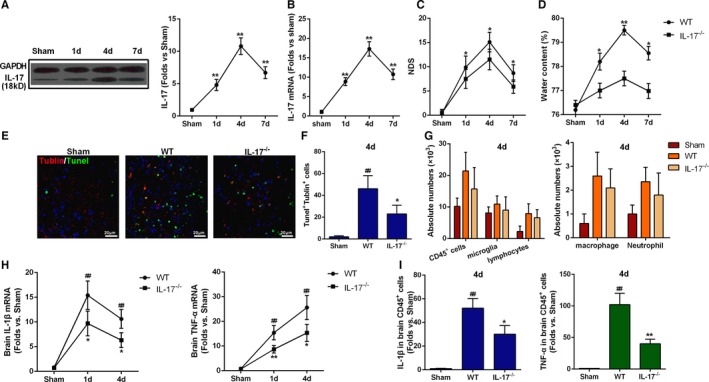
Figure 6.

Interleukin (IL)‐17 aggravated brain injury induced by intracerebral hemorrhage (ICH). A and B, IL‐17 protein and mRNA expression in the perihematoma tissues at days 1, 4, and 7 after ICH. **P<0.01 vs sham, n=5. C, Neurologic deficit score (NDS) for wild‐type (WT) and IL‐17−/− mice at 1, 4, and 7 days after ICH. **P<0.01 vs sham, n=5. Two‐way ANOVA reported significant difference in main effects of genotype (P<0.05) but not of time points (P>0.05), there was no interaction between genotype and time points (P>0.05). D, Brain water content for WT and IL‐17−/− mice at 1, 4, and 7 days after ICH. **P<0.01 vs sham, n=5. E, Representative immunofluorescence staining images showing βIII tubulin and terminal deoxynucleotidyl transferase dUTP nick end labeling (TUNEL) double‐positive cells around the perihematoma of WT and IL‐17−/− mice at day 4 after ICH. Scale bars=20 μm,*P<0.05 vs WT, ## P<0.01 vs sham, n=5. F, Quantification of the βIII tubulin and TUNEL double‐positive cells in the perihematoma of WT and IL‐17−/− mice at 4 days after ICH. *P<0.05 vs WT, ## P<0.01 vs sham, n=5. G, Absolute numbers of cells (CD45+ cells, microglia, lymphocytes, macrophages, and neutrophils) in sham‐treated, WT, and IL‐17−/− mice. Data were obtained for samples pooled from 5 mice, and the experiments were repeated 3 times. H, mRNA levels of IL‐1β and tumor necrosis factor‐α (TNF‐α) in brain tissue at 1, 4, and 7 days after ICH. I, mRNA levels of IL‐1β and TNF‐α in infiltrating CD45+ cells at day 4 after ICH. *P<0.05, **P<0.01 vs WT, ## P<0.01 vs sham, n=5.
