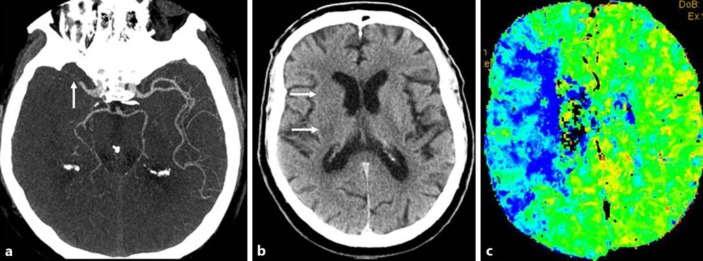
Fig. 2.
a CT angiography of the brain showed occlusion of the M1 segment of the middle cerebral artery on the right side (arrow). b CT of the brain exhibited decreased attenuation of the right basal ganglia in keeping with infarction (arrows). c CT perfusion of the brain showing increased mean transit time in the middle cerebral artery territory on the right side (blue area).

