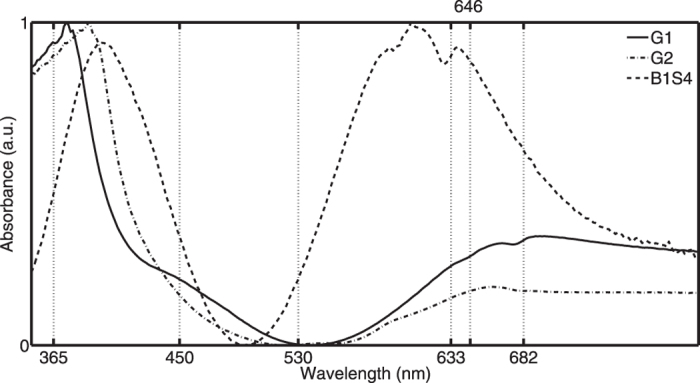
Figure 3. All green fragments could be classified in two groups (G1 and G2) based on spectral shape differences (the sample numbers of each group population are given in Supplementary Table 1).

Cr3+ and Cr6+ optical fingerprints are observed in all green pot-coloured panes. The observed spectral positions of the chromium bands match with those of a reference sample B1S4 (chemical data is provided in Supplementary Table 2).
