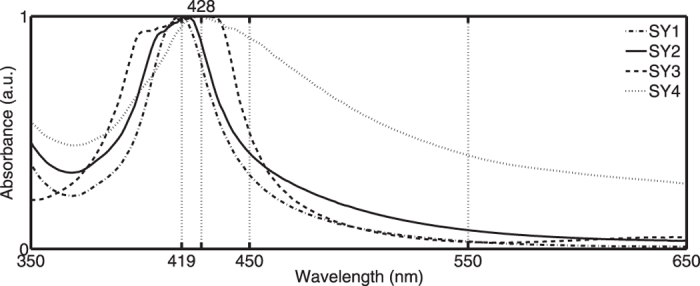
Figure 8. Spectral signature differences classify all stained fragments in four groups SY1–SY4 (the sample numbers of each group population are given in Supplementary Table 1).

SY1–3 have an almost coincident absorption maximum close to 419 nm and differ in FWHM value. Panes of SY4 have red-shifted spectra with broad FWHM values tailing towards 450–550 nm.
