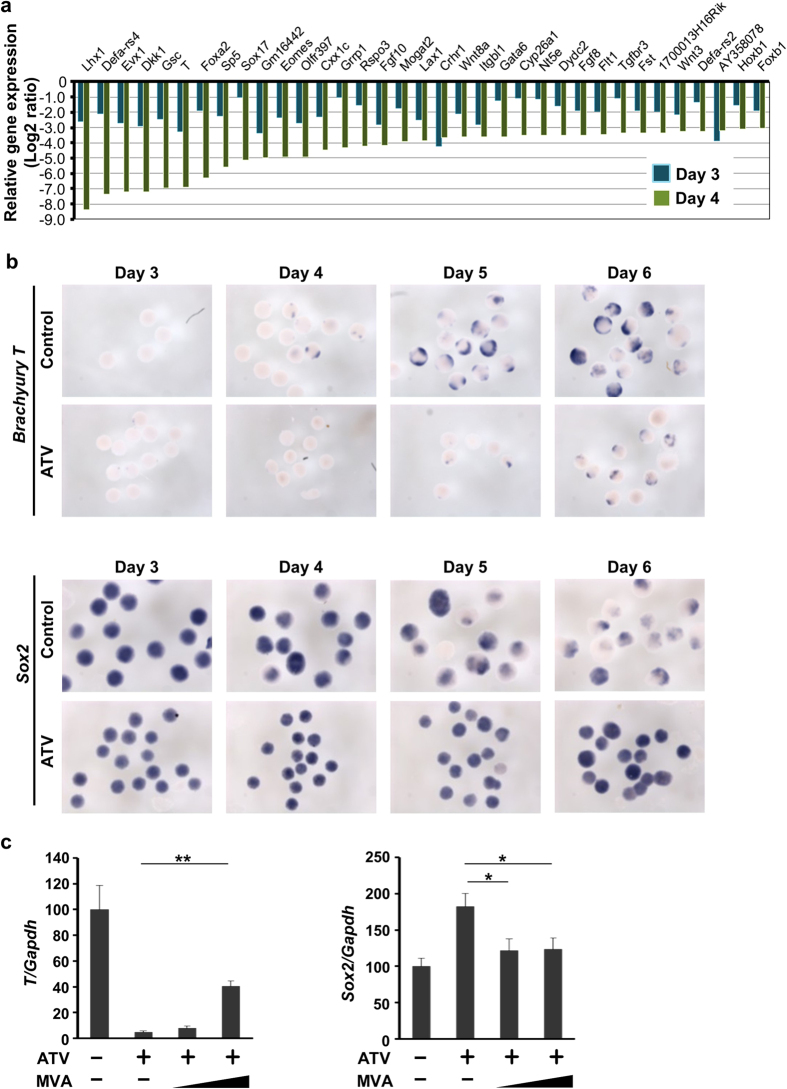
Figure 2. The effects of statins on primitive streak formation in mouse EBs.
(a) Microarray results for the top 35 downregulated genes in EBs treated with ATV during days 1–4. Data were compared with control EBs and analysed on days 3 and 4. Gene expression levels in ATV-treated EBs are expressed as Log2 (fold change) values relative to control EBs. (b) In situ hybridisation to detect T and Sox2 in EBs treated with or without ATV on days 1–6 and collected at the indicated times. Results are representative of >100 EBs/group. (c) Real-time PCR of T and Sox2 in EBs treated with or without ATV and/or MVA during days 1–4 and collected on day 4. Results were analysed as in Fig. 1b. *P < 0.05, **P < 0.0001.

