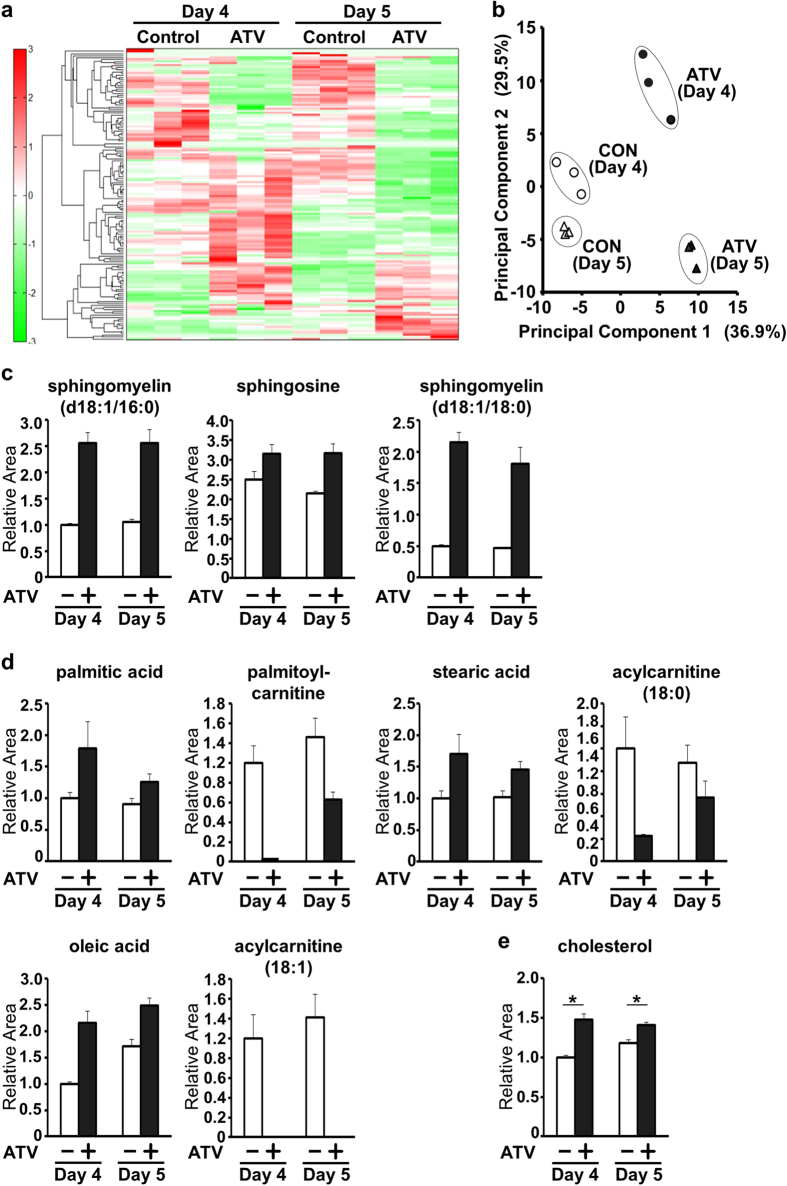
Figure 3. Metabolomic analysis of statin-treated mouse EBs.
(a) Heat map showing differences in the profiles of 147 metabolites in EBs that were treated with or without ATV during days 3–5 and subjected to metabolomic analysis on days 4 and 5. (b) Principal component analysis of the EBs in (a). Principal components 1 and 2 account for 36.9% and 29.5% of total variance, respectively. (c) Intracellular levels of the indicated metabolites in the EBs in (a). Data are expressed as the relative area of signal peaks corresponding to each metabolite and represent the mean ± SD (n = 3). (d) Intracellular levels of the indicated free FAs and acylcarnitines in the EBs in (a) analysed as in (c). (e) Intracellular cholesterol levels in the EBs in (a) analysed as in (c). *P < 0.005.

