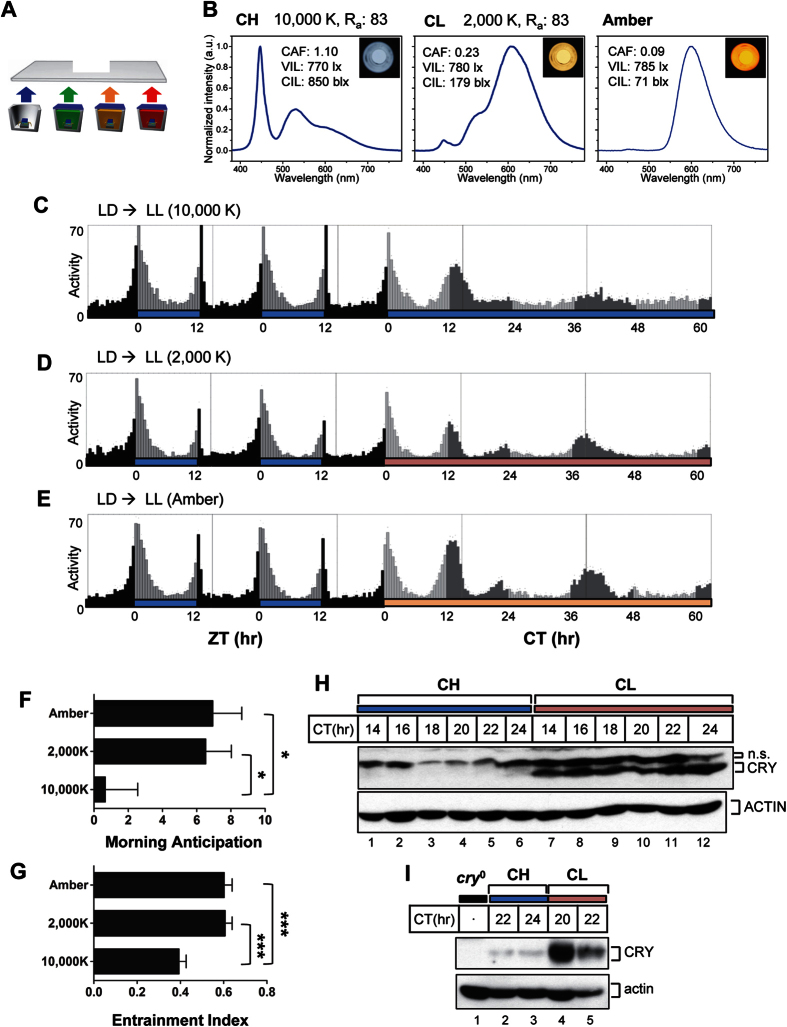
Figure 1. White LEDs with high circadian illuminance (CIL) abolish circadian rhythm more rapidly than LEDs with low CIL.
(A) Schematic illustration of color-tunable and high-color quality four-package white LEDs using B semiconductor-type LEDs and long-wavelength pass dichroic filter (LPDF)-capped monochromatic green, amber, and red phosphor-converted LEDs. (B) Spectral power distribution of CH (cool white, 10,000 K), CL (warm white, 2,000 K), and amber LEDs are shown. (C to E) Locomotor activity of w1118 flies under different light conditions. w1118 flies were entrained by daily cycles of 12 h 10,000 K light followed by 12 h complete darkness (LD). After 4 days of entrainment, flies were exposed to constant light (LL) from the three kinds of LED. Light blue, pink, and amber horizontal bars indicate 10,000 K, 2,000 K, and amber LED lights whose qualities are shown in (B). Black horizontal bars indicate complete darkness. Each vertical bar represents average relative activity during a 30-min bin. During the LD cycles, light gray vertical bars represent activity during lights-on periods and black vertical bars represent activity during lights-off periods, whereas during LL conditions, light gray vertical bars represent locomotor activity during subjective day and dark gray vertical bars represent activity during subjective night. ZT, zeitgeber time; ZT0, lights-on time; CT, circadian time; CT0, subjective lights-on time. (F) Morning anticipation values and (G) entrainment indices were calculated for the three different LED light conditions. The numbers of flies used for the analyses shown in (C–G) are 31, 30, and 31 for 10,000 K, 2,000 K, and amber, respectively. Error bars denote standard error of the mean (SEM). Data were compared by pairwise Student’s t-test. *p < 0.05, ***p < 0.0001. (H,I) Flies were exposed to constant CH light or CL light, and heads were collected at indicated time points. Protein extracts were analyzed by immunoblotting with anti-CRY (Rb2) antibody. Note that CRY levels were higher in CL light than in CH light at every time point tested. n.s. denotes for non specific band.

