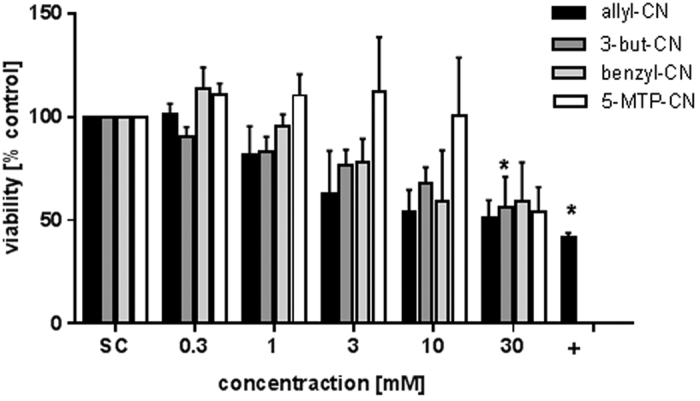
Figure 4. Analysis of cell viability in primary murine hepatocytes after a 72 hours treatment with nitriles using WST-1 assay.

+: Positive control, 0.05% triton-X. Bars are mean + SEM, n ≥ 3. *P < 0.05; asterisks indicate a significant difference between the sample and the solvent control, medium.
