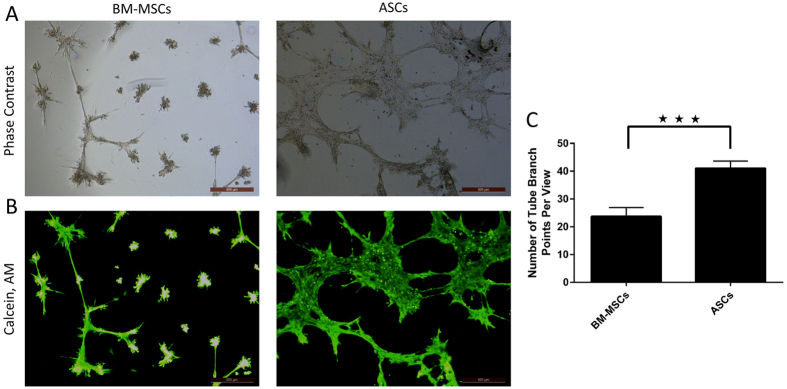
Figure 4. ASCs have a more potent pro-angiogenic effects when compared to BM-MSCs).
Upper panel is the phase contrast image of the field shown on the below panel (A). Tubular structures were photographed (A and B) and then quantified by counting the number of branch points (C). In vitro tube formation assay (A and B) and tube branch points (C). Representative images are displayed and data are shown as mean ± S.D. (error bars) of counted tube branch points from 4 microscopic fields of three independent replicates. ***p < 0.005. Scale bars, 500 μm.

