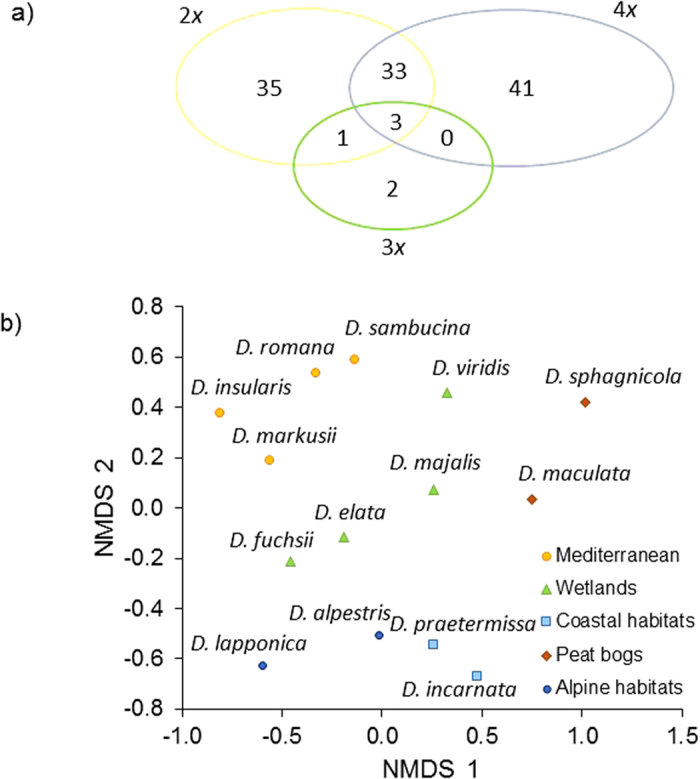
Figure 2. Partitioning of mycorrhizal communities detected in fourteen different Dactylorhiza species sampled in 35 populations across Europe.

(a) Venn diagram showing the number of OTUs that are shared between diploid (2x), triploid (3x) and tetraploid (4x) Dactylorhiza species. (b) Nonmetric multidimensional scaling (NMDS) plot of mycorrhizal fungi. Each point denotes a different Dactylorhiza species. Different colors denote the habitats from which the species were sampled.
