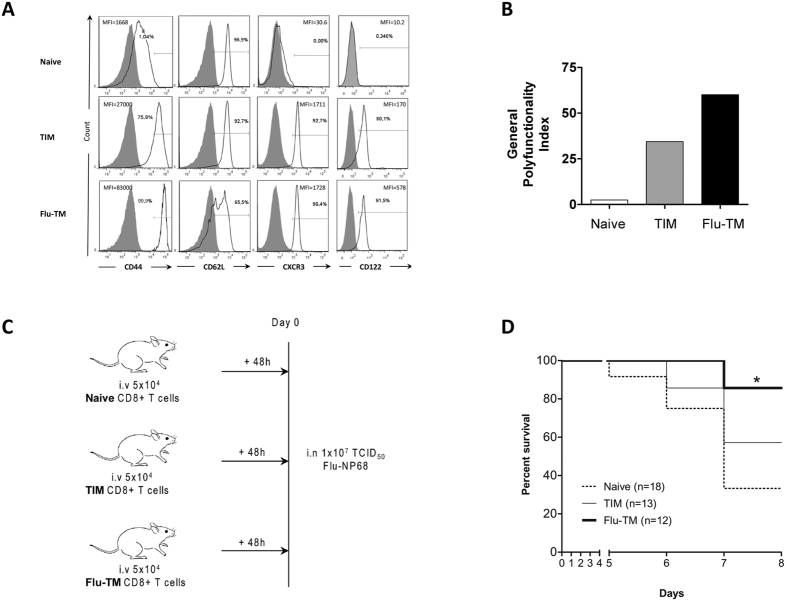
Figure 1. Comparison of phenotype and protective capacity between two memory CD8 T cell populations.
(A) Naive, TIM and Flu-TM CD8 T cells were stained with the indicated antibodies (black histogram) or isotype control (filled gray histogram). Data show expression on gated F5 CD8 T cells and are representative of five independent experiments. (B) Polyfunctionality index (calculated as described in the Methods) of specific CD8 T cells was assessed for the simultaneous production of 4 cytokines: IFN-γ, IL-2, CCL3 and CCL5. Data show one out of five independent experiments with similar results. (C) Experimental plan and (D) survival curves of infected mice. Mice were transferred with 5 × 10⁴ naive or TIM or Flu-TM CD8 T cells and infected intranasally 48 hours later with a lethal dose of Flu-NP68 (1 × 10⁷ TCID50). Data are mean of 2 independent experiments. Total number of mice is indicated in brackets. Survival was significantly improved in the Flu-TM group as compared with naive group (*p < 0.05 Log-rank test).

