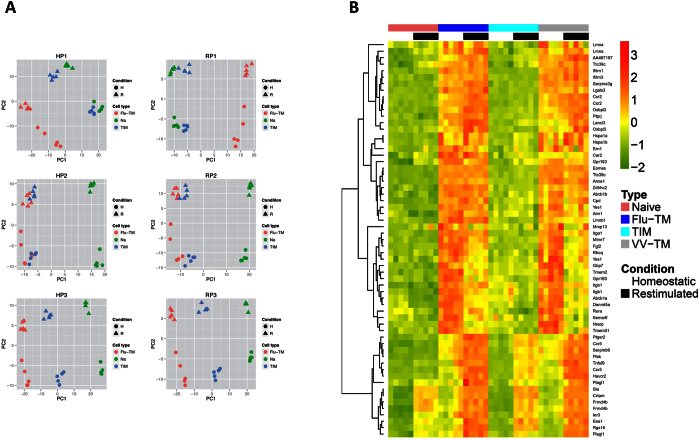
Figure 2. Discretized comparison defined gene clusters that discriminate naive, TIM and Flu-TM cells.
(A) Principal component analysis of probe sets belonging to the P1, P2 or P3 gene lists defined by the discretized comparison of gene expression profiles in homeostatic (H) or re-stimulated (R) conditions. For each probe set, the complete gene expression profile i.e. expression value in each condition (homeostatic and re-stimulated) has been used for the PCA analysis. (B) Expression heatmap of the top 55 HP1 genes with a minimal FC of 4 when comparing Flu-TM to naive cells. Expression profiles in naive cells, Flu-TM, TIM and VV-TM in homeostatic conditions and following restimulation are shown. Colors represent the centered and scaled signal intensity.

