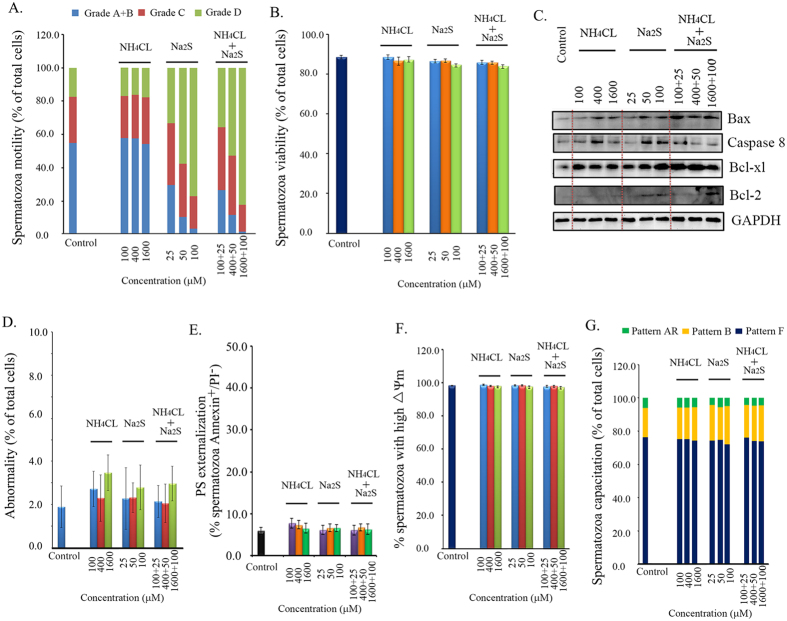
Figure 1.
(A) Spermatozoa motility determined by CASA. Y-axis = % of total cells, X axis = the treatment concentration (μM). n = 6–8. (B) Spermatozoa viability. Y-axis = % of total cells, X-axis = the treatment concentration (μM). n = 6–8. (C) Protein levels of apoptotic markers detected by Western blotting. n = 3. (D) The abnormality of boar spermatozoa detected by eosin Y staining. n = 5. (E) Spermatozoon plasma membrane phosphatidylserine (PS) externalization. n = 4. (F) The mitochondrial membrane potential (△Ψm) was measured by the specific probe JC-1 using flow cytometry. Y-axis = % of total cells with high membrane potential, X-axis = the treatment concentration (μM) n = 4. (G) Spermatozoa capacitation status detected by CTC staining. Y-axis = % of total cells, X axis = the treatment concentration (μM). n = 4.

