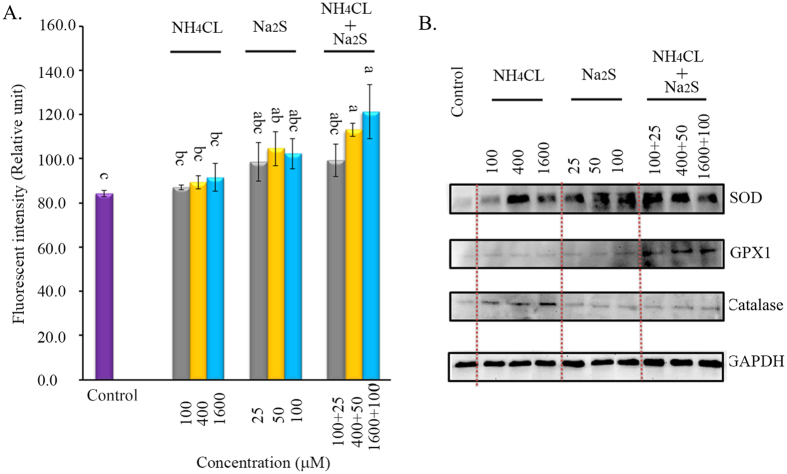
Figure 2.
(A) ROS levels in all the treatments by H2DCFDA kit using flow cytometry. Y-axis = the fluorescent intensity (relative unit). X-axis = the treatment concentration (μM). a,b,c Means not sharing a common superscript are different (p < 0.05). n = 3. (B) Protein levels of SOD, GPX, and catalase detected by Western blotting. n = 3.

