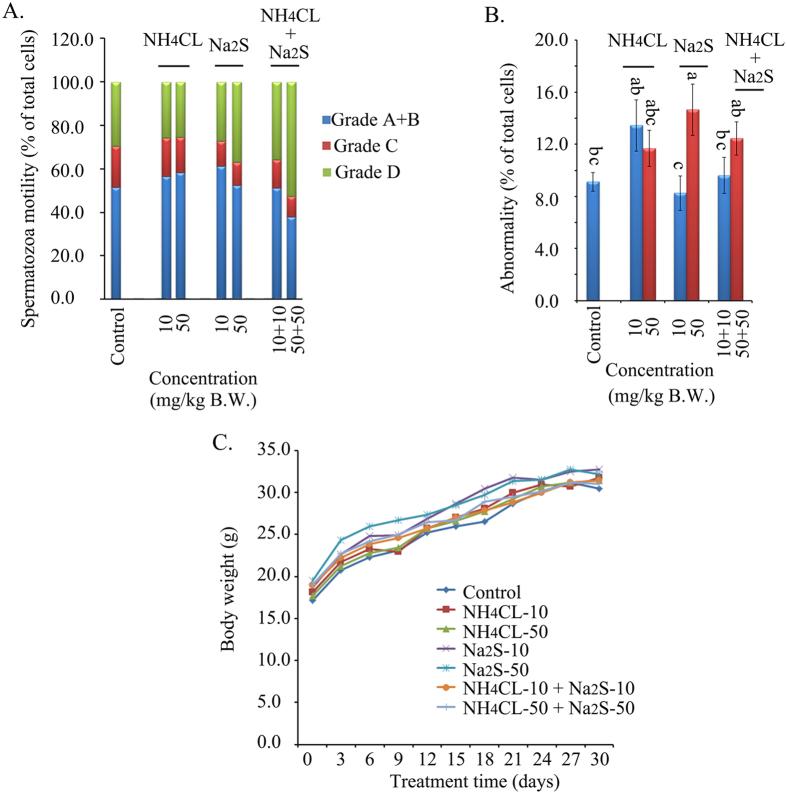
Figure 6. (A).
Mouse spermatozoa motility determined by CASA. Y-axis = % of total cells, X-axis = the treatment concentration mg/kg B.W. (p < 0.05). n = 8. (B) The abnormality of mouse spermatozoa detected by eosin Y staining. a,b,c Means not sharing a common superscript are different (p < 0.05). (C) Mouse body weight. Y-axis = body weight (g), X-axis = the treatment time (day). n ≥ 4.

