
Figure 3. Gene disruption using CA-NHEJ in E. coli.
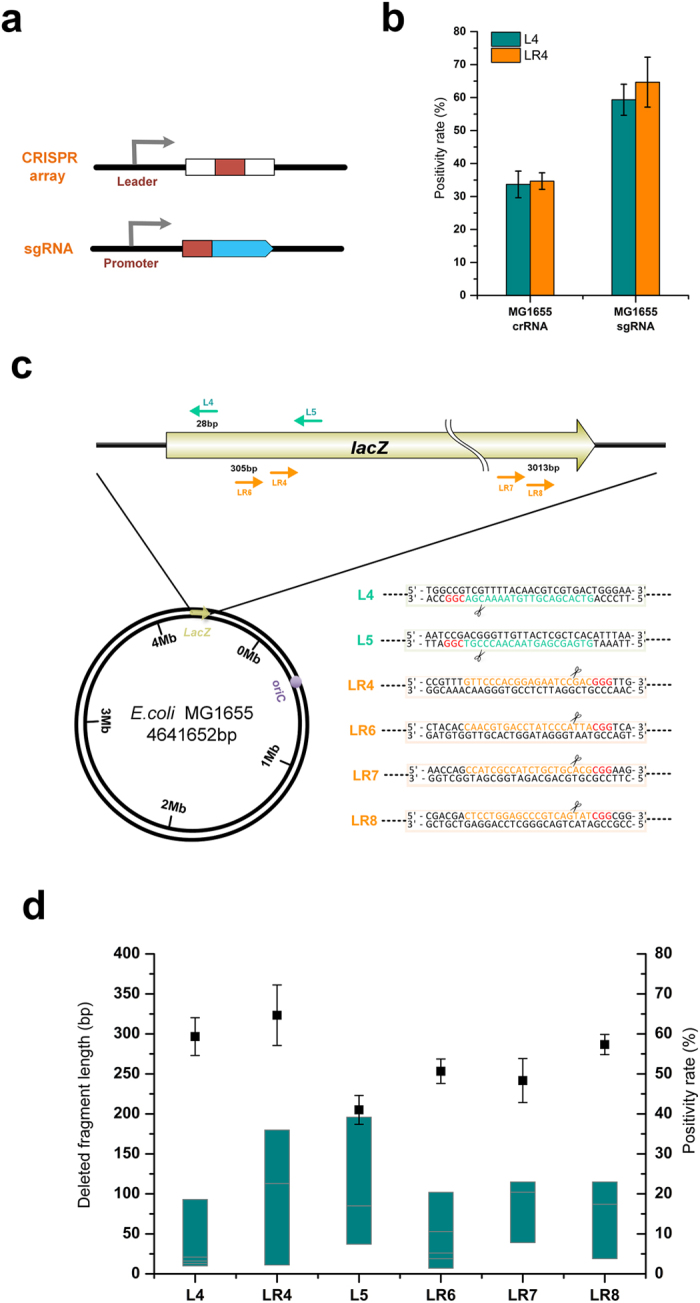
(a) The structure of the natural CRISPR array and the artificial single-guide RNA (sgRNA). White: repeat sequences; red: spacer sequences; blue: RNA domains for Cas9 binding and a 40-nt transcription terminator. (b) The lacZ mutagenesis positivity rate in strain MG1655 using spacers expressed by the CRISPR array or sgRNA cassette. Two spacers, L4 and LR4, targeting the sense strand and the antisense strand of lacZ, were tested, respectively. The positivity rate was statistically calculated based on the proportion of white colonies on the X-gal plate. The error bars represent standard deviations from three replicate experiments. (c) Distribution of sgRNAs designed to target the lacZ gene in strain MG1655. The location of the designed spacers, the spacer sequences, the PAM (protospacer adjacent motif) sequences, and the cleavage sites are detailed and highlighted. (d) The positivity rate of lacZ mutagenesis and the range of DNA end fragment deletion using various sgRNAs. The positivity rate shown is representative of three replicate experiments. Solid square: the positivity rate of lacZ mutagenesis; dark cyan bar: the length of DNA end fragment deletion. For each sgRNA target, eight white colonies were randomly picked for Sanger sequencing to determine the length of the deleted fragment at the junction.