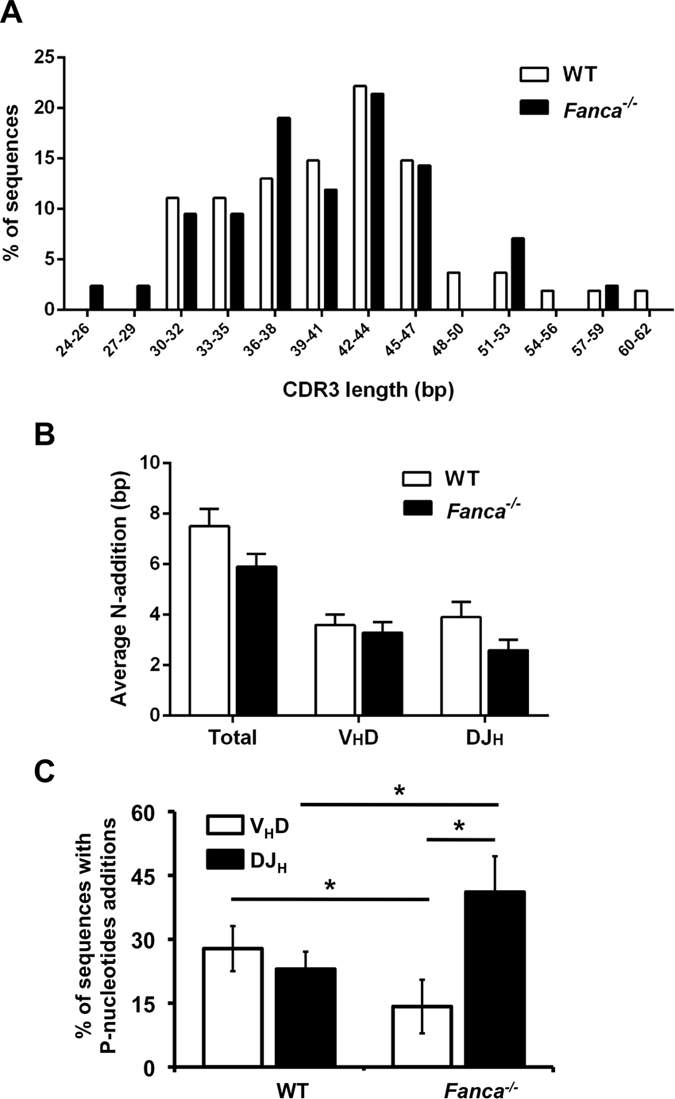
Figure 2. Normal heavy chain rearrangement in Fanca−/− mice.

(A) Distribution of CDR3 lengths of VHDJH4 rearrangements amplified from genomic DNA that was isolated from BM IgM− B cells of Fanca−/− and WT mice. The average values are listed in Table 1. (B) Average numbers of added N-nucleotides per sequence in VHDJH4 rearrangements of Fanca−/− and WT mice are plotted either for VH to DJH and D to JH junctions (“Total”) or for VH to DJH (“VHD”) alone or D to JH (“DJH”) junctions alone. The results are displayed as the mean ± SEM. (C) The proportion of P-nucleotide additions at either the VH to DJH4 (“VHD”) or the D to JH4 (“DJH”) junctions. The data for HC rearrangements are from three independent pools of three mice per genotype (the numbers of sequences analysed are indicated in Table 1).
