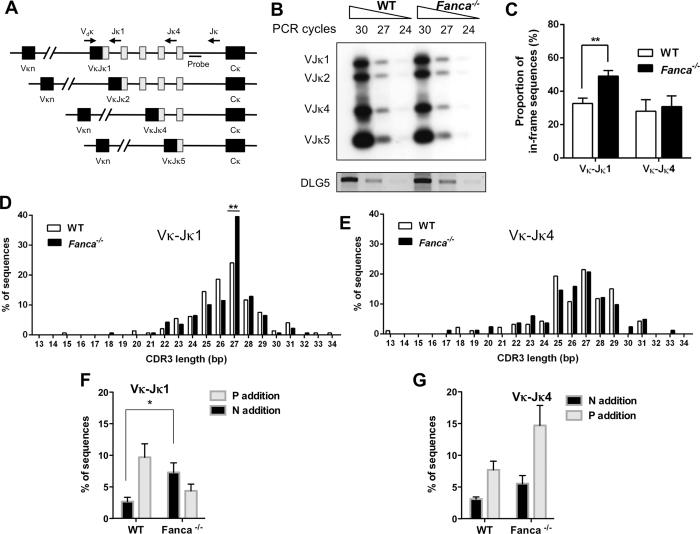
Figure 3. Fanca−/− mice accumulate in-frame Vκ-Jκ1 junctions in BM IgM− B cells.
(A) Schematic diagrams (not to scale) of the PCR assays used to determine LC rearrangement. The top map shows the positions of a degenerated Vdκ gene 5′ primer and Jκ1, Jκ4 and Jκ 3′ primers along with the position of a probe used in Southern blotting. Below are shown the four possible rearranged products resulting from Vκ joining to the different Jκ gene segments. (B) Semi-quantitative PCR at different cycles and a Southern blot analysis of the rearrangements of Vκ gene segments to Jκ1 to Jκ5 gene segments in IgM− B cells sorted from the BM of Fanca−/− and WT mice. The DNA input was normalized to DLG5 PCR products (below). Original images were reported in Supplemental Figure S4. (C) Proportions of in-frame Vκ-Jκ1 and Vκ-Jκ4 rearrangements amplified from genomic DNA isolated from BM IgM− B cells of Fanca−/− and WT mice. The data are displayed as the mean ± SEM of 4 mice per genotype from 4 independent experiments for Vκ-Jκ1 rearrangements (**p < 0.01 with a 2-tailed Student’s paired t-test) and 3 mice per genotype from 3 independent experiments for Vκ-Jκ4 rearrangements. (D,E) Distribution of CDR3 lengths of Vκ-Jκ1 and Vκ-Jκ4 rearrangements from BM IgM− cells of Fanca−/− and WT mice, respectively (**p < 0.01 with Fisher’s exact test). The average values and numbers of the sequences analysed are listed in Table 1. (F,G) Proportions of P- and N-nucleotide additions in the Vκ-Jκ1 and Vκ-Jκ4 rearrangements, respectively, from BM IgM− cells of Fanca−/− and WT mice. The data are displayed as the mean ± SEM of 4 mice per genotype from 4 independent experiments for Vκ-Jκ1 rearrangements and 3 mice per genotype from 3 independent experiments for Vκ-Jκ4 rearrangements.

