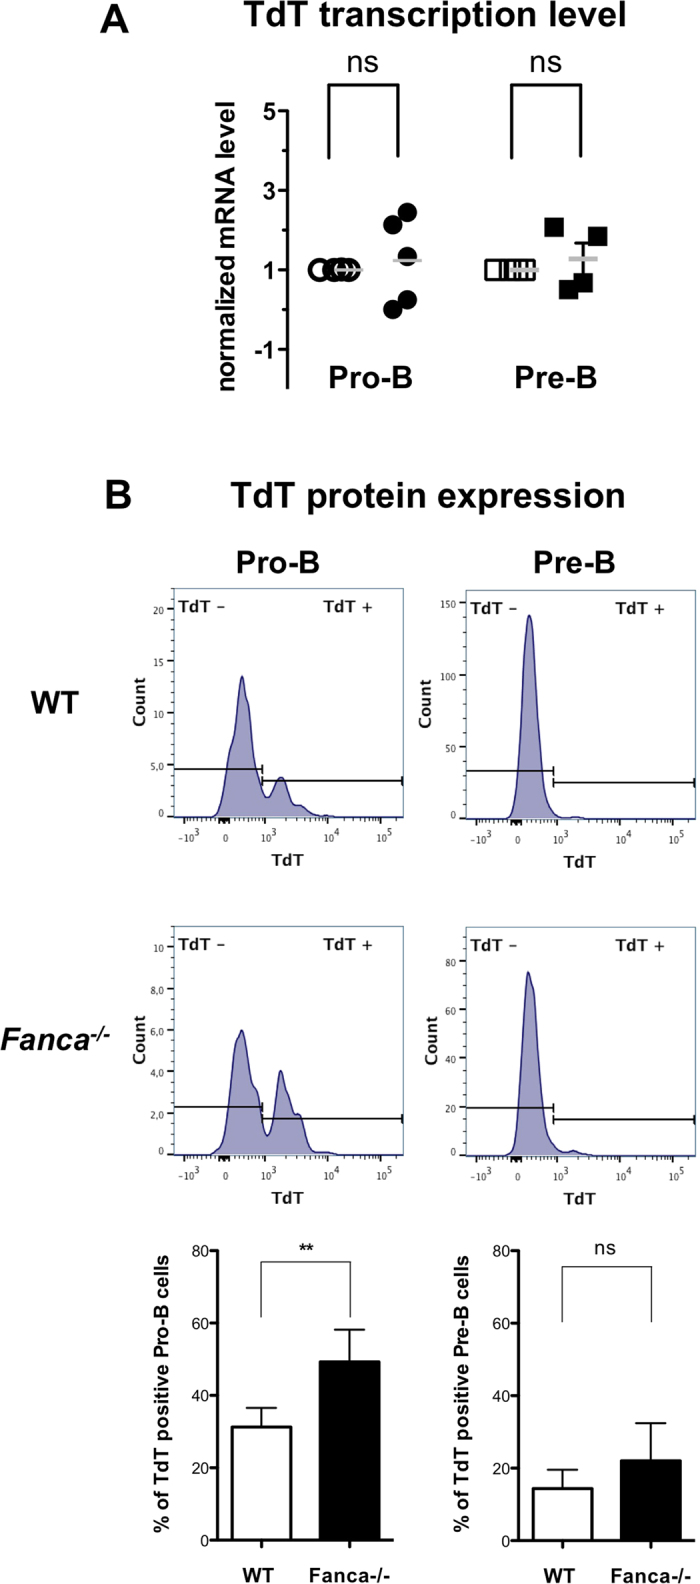
Figure 4. Fanca deficiency increases TdT protein expression in pro-B and pre-B cells.

(A) Quantitative reverse transcriptase-polymerase chain reaction analysis of TdT transcript expression in sorted pro-B and pre-B Fanca−/− cells. Open symbols represent WT mice and filled symbols represent Fanca−/− mice. The results were calculated relative to the WT and normalized against the level of actin (mean ± SEM; n = 4 for pre-B and n = 5 for pro-B cells). (B) TdT protein expression estimated by flow cytometry (the gating strategy is shown in Fig. S2) in pre-B (B220+ IgM− CD43low) and pro-B (B220+ IgM− CD43low) cells derived from the BM of Fanca−/− and WT mice (mean ± SEM; n = 5 per genotype).
