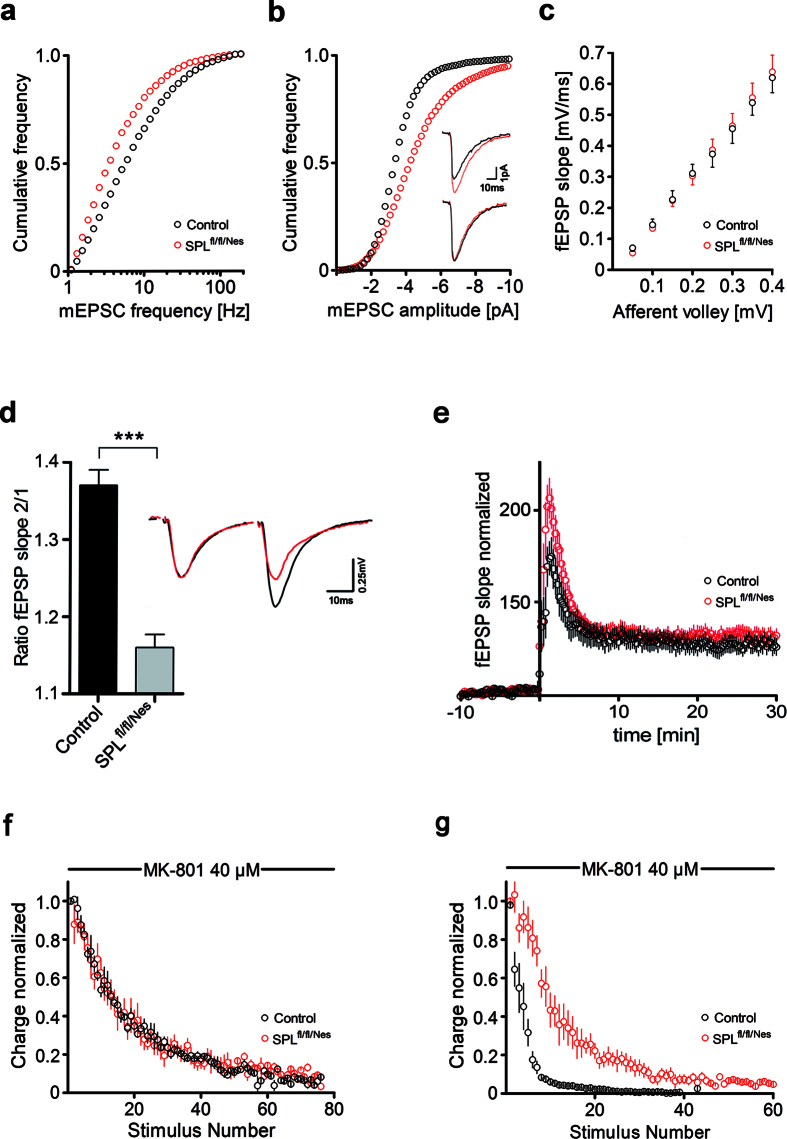
Figure 3. Electrophysiology of Schaffer collateral synapses in CA1 region of murine hippocampus with ablation of SPL.
(a) mEPSC frequency is significantly reduced and (b) mEPSC amplitude significantly increased in SPLfl/fl/Nesslices compared to controls. Cumulative frequencies of occurrence of mEPSC frequencies and mEPSC amplitudes are plotted. (b) Inset shows examples of mEPSC traces (black: control; red: SPLfl/fl/Nes), lower traces are normalized in amplitude. (c) normal basal synaptic transmission as shown in the input-output curves. (d) PPF is significantly reduced at Schaffer collateral synapses from SPLfl/fl/Nes mice compared to controls. Ratios of the initial slopes of fEPSP pairs are plotted. Inset shows example traces at 40 ms stimulus interval (black: control; red: SPLfl/fl/Nes). (e) LTP recorded in the hippocampal CA1 region after high frequency stimulation (100 Hz, 1 s) of Schaffer collaterals in control and SPLfl/fl/Nes slices is unchanged. fEPSP slopes are expressed as percentage of change from baseline recordings (taken to be 100%) and plotted against time. (f) blocking rate of the NMDA responses by 40 μM MK-801 does not significantly vary between control and SPLfl/fl/Nes synapses. Results are displayed as 3 point bins. (g) blocking rate of the NMDA responses elicited by short trains (3 pulses, 10 ms interval, 0.05 Hz) is slower at SPLfl/fl/Nes synapses compared to controls. Results are displayed as 3 point bins. (a,b) n: mEPSCs/mice, control: 4038/6, SPLfl/fl/Nes: 3886/6; data in c-g represent means ± SEM; c, n: slices/mice, control: 12/3, SPLfl/fl/Nes: 11/3; (d) n: slices/mice, control: 30/10, SPLfl/fl/Nes: 48/16; e, n: slices/mice, control: 15/5, SPLfl/fl/Nes: 19/6; (f) n: neurons/mice, control: 5/4, SPLfl/fl/Nes: 5/4; (g) n: neurons/mice, control: 6/4, SPLfl/fl/Nes: 6/5; unpaired t-test, ***P < 0.0001.

