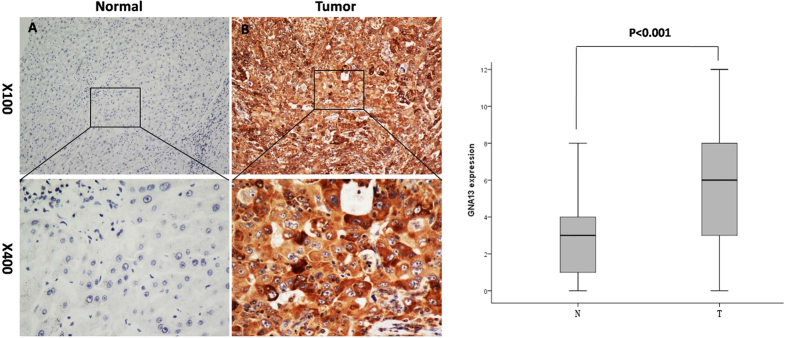
Figure 2. Representative images of GNA13 expression in adjacent non-cancerous liver tissues and HCC tissues via IHC.
GNA13 was absent or only weakly detected in adjacent normal liver cells (A), whereas its upregulation was mainly detected in HCC tissues (B) (original magnification, x100 and x400)(Left). The box plot showed the mean staining score of GNA13 in HCC tissues (T) and the adjacent non-cancerous liver tissues (N) (P < 0.001)(Right).

