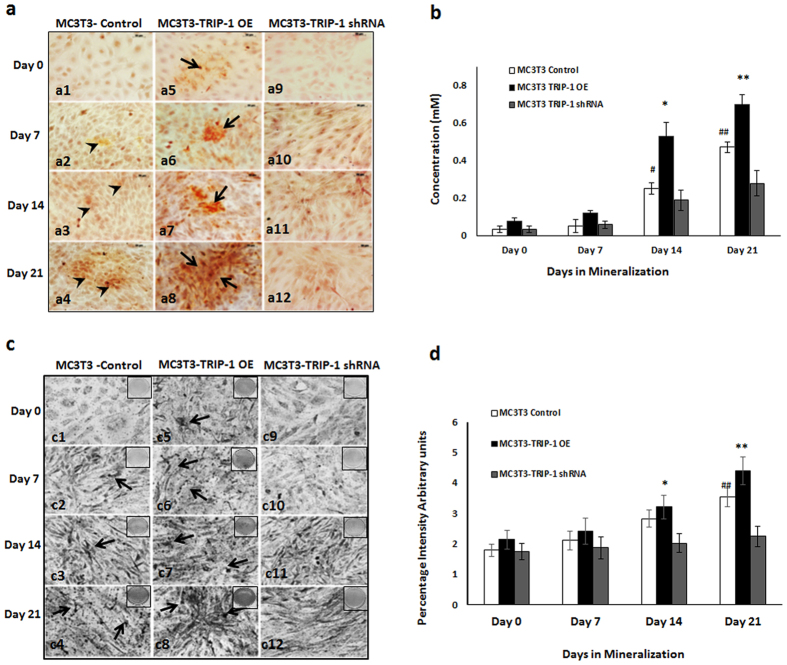
Figure 5. TRIP-1 influences matrix mineralization.
MC3T3-E1 control cells, overexpressing TRIP-1 cells and shRNA mediated TRIP-1 knockdown cells were grown in osteogenic differentiation medium from 0 to 21 days. (5a) Representative Alizarin Red staining images demonstrate the presence of calcium in the matrix. Note the increased calcium deposition in TRIP-1 overexpressing cells from 0-21 days (Black arrows). Increased calcium deposition was also observed in control cells at 21 days albeit lesser than TRIP-1 overexpressed cells. Scale bars, 50 μm. (5b) Quantitative analysis of Alizarin Red staining. The cultures were destained and extracted using 10% acetic acid. Concentration determined measuring absorbance at 405 nm against Alizarin Red standard shows significant increase in 14 and 21-day TRIP-1 over expressing cells when compared to control cells. (5c) Representative images of von Kossa staining. Note the presence of intense black deposits indicating phosphate deposition in the matrix of cells overexpressing TRIP-1 (black arrows). (5d) Graph showing changes in the mineralization amounts in (5c), as percentage positive intensity units as analyzed by Image J. Students t test was used to calculate statistical significance. *, # Represents significance of p < 0.05.

