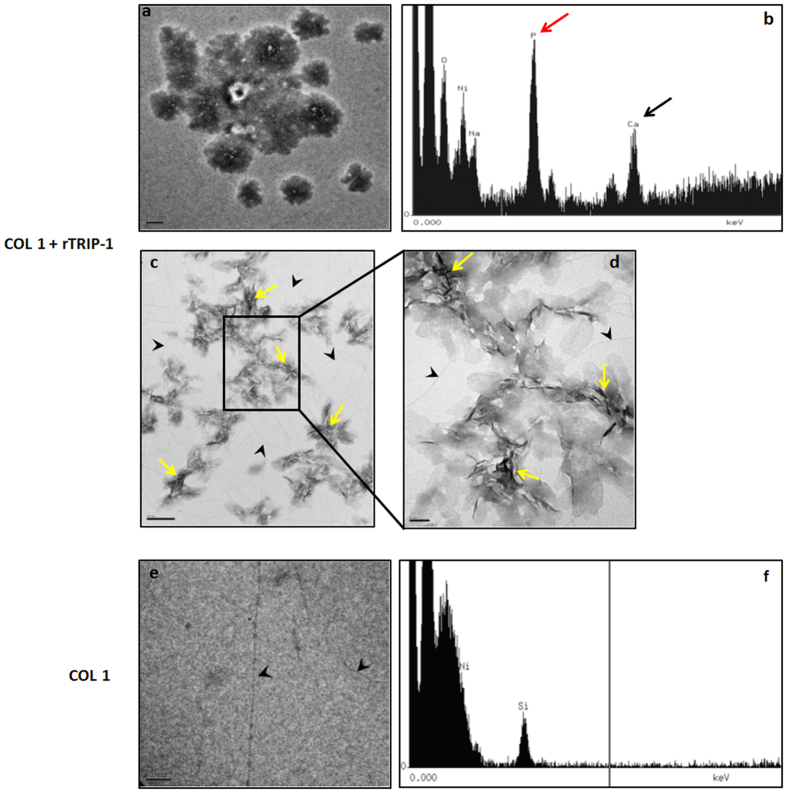
Figure 9. Transmission Electron microscopy analysis and corresponding EDS spectra of the mineral deposits in the presence of rTRIP-1 and Type I collagen.
(9a) Representative unstained TEM image of mineral crystal nucleated by 20 μg of TRIP-1 on type I coated collagen nickel grids subjected to mineralization for 1 h in the presence of 1 M Ca2+ and phosphate buffer. (9b) Corresponding EDS analysis showing that the mineral deposits contain calcium and phosphate. (9c & 9d) Needle-shaped crystals (yellow arrows) emerge from the initial amorphous phase. Black arrowheads indicate type 1 collagen. (9e & f) Representative TEM image showing the absence of mineral deposits on the control grids coated with Type 1 collagen.

