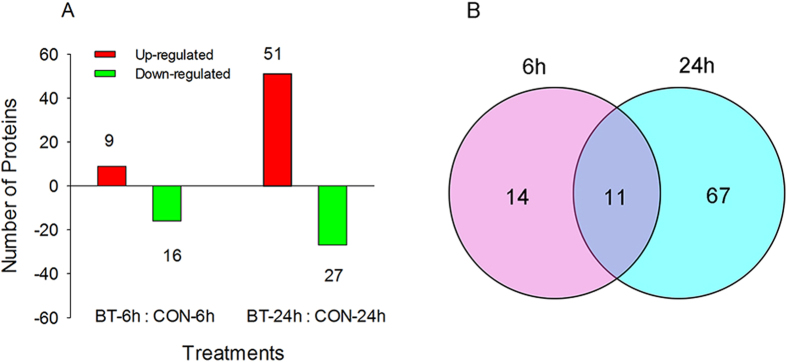
Figure 4.
(A) The number of up- and down-regulated proteins of B. odoriphaga after treatment with benzothiazole for 6 and 24 h. BT: benzothiazole; CON: control. (B) Venn diagram showing the overlap between the differentially expressed proteins of B. odoriphaga at 6 and 24 h after benzothiazole treatment.

