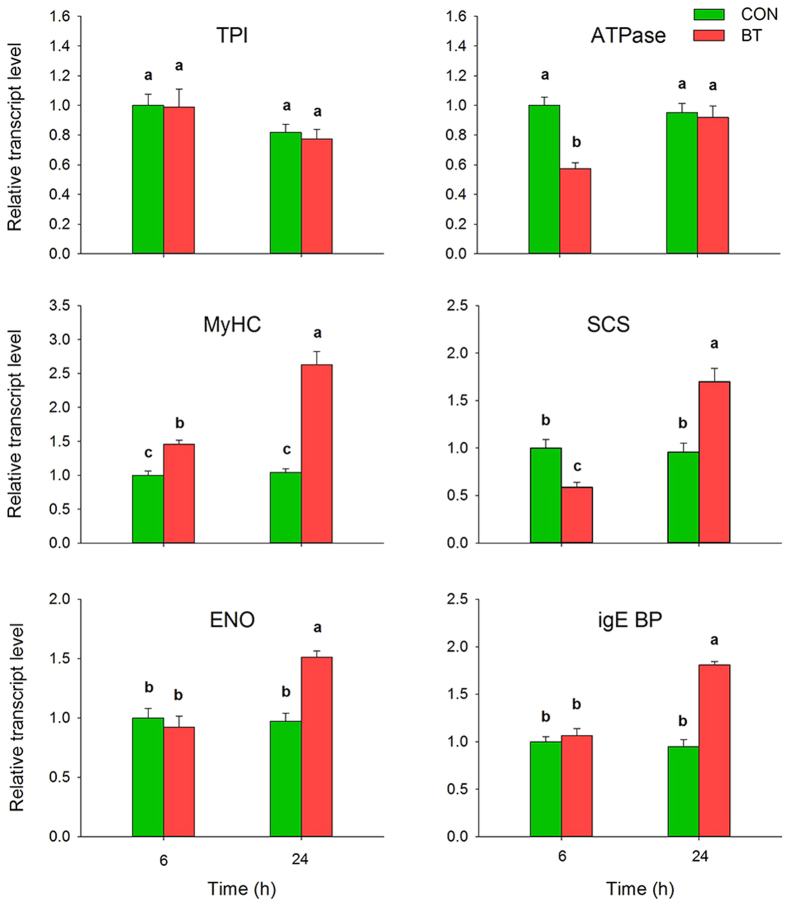
Figure 6. mRNA expression level analysis (qRT-PCR) of 6 proteins of B. odoriphaga after 6 and 24 h of benzothiazole treatment.
The relative expression level was normalized to an internal standard, ribosomal protein S3 (RPS3). Bars represent mean ± SE (n = 6). Different lower-case letters above the bars indicate significant differences at P < 0.05. TPI: triose-phosphate isomerase; V-ATPase: vacuolar ATP synthase subunit H; MyHC: myosin heavy chain; SCS: succinyl-CoA synthetase; ENO: enolase; epsilon BP: IgE binding protein.

