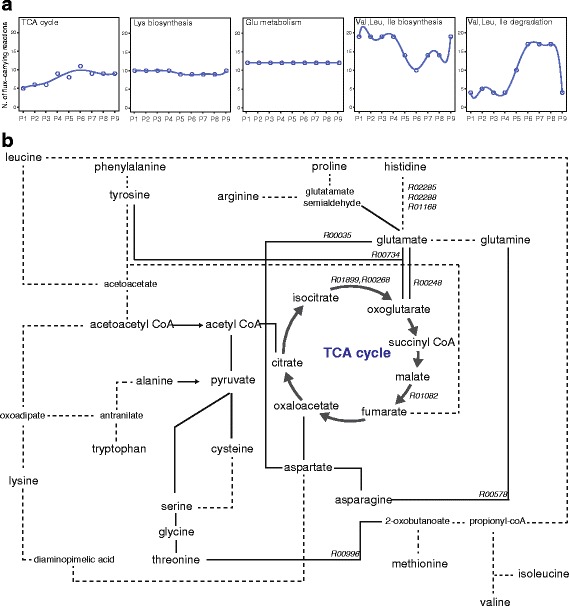
Fig. 2.

Changes in the central metabolism of PhTAC125. a. The number of active (flux-carrying) reactions for five major pathways across all the time points is shown. b. A simplified representation of the interconnections in the central metabolism of PhTAC125. Dashed lines indicate the presence of more than one reaction between the connected compounds. Modified from [39]
