Fig. 5.

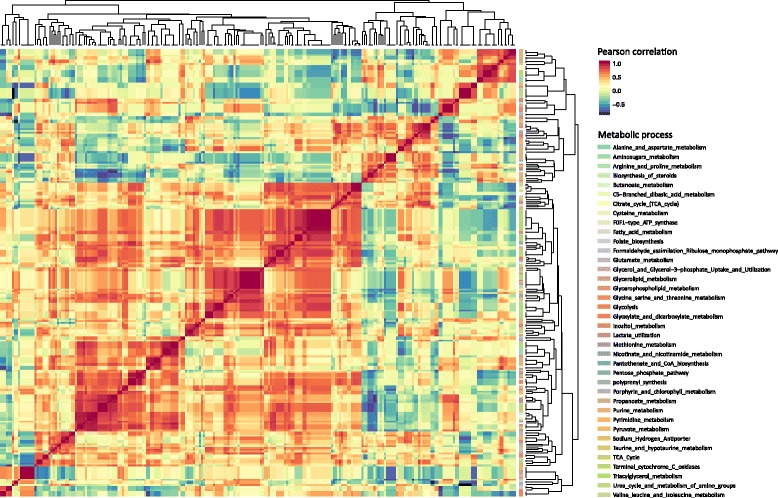
Flux correlation analysis. Heatmap accounting for the Pearson correlation of all the flux difference vectors across all the time points. The metabolic process of each reaction is also reported

Flux correlation analysis. Heatmap accounting for the Pearson correlation of all the flux difference vectors across all the time points. The metabolic process of each reaction is also reported