
Fig. 6.
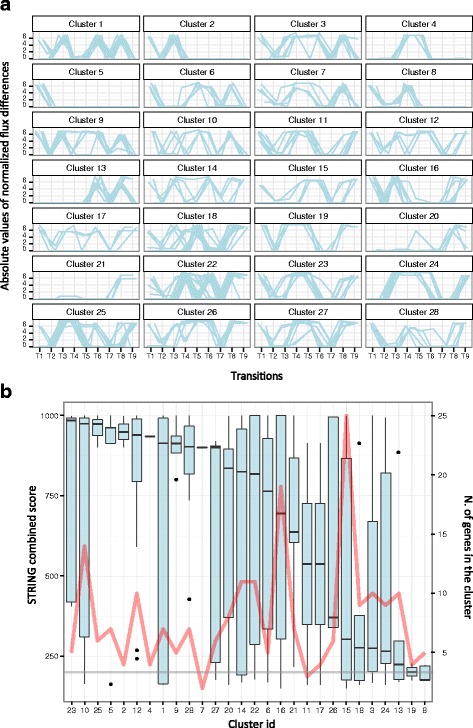
a. Co-varying reactions clusters identification. Common flux trends (expressed as the normalized difference between the absolute value of fluxes across each growth phase and the following one) for the reactions embedded in each of the 28 clusters. b. The distribution of STRING combined scores among all the genes embedded in each cluster of genes (primary y axis) and the number of genes embedded by each cluster (secondary y axis, red line). The grey line represents the median of the combined score computed for each possible pair of genes in the model