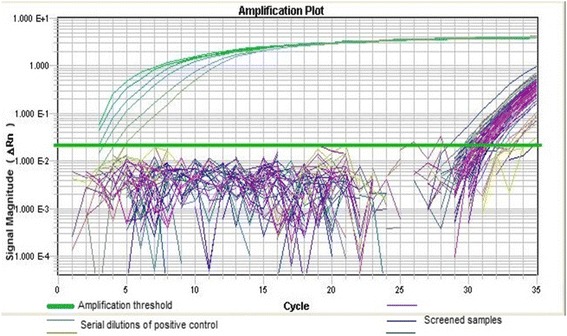
Fig. 2.

Fluorescence signal magnitude plot against PCR cycles generated from the real- time PCR: Serial dilutions of the positive control generated detectable amplification signals before the 5th cycle. The screened samples that were positively amplified generated detectable amplification signals after the 25th cycle. Positive samples had a CT value above 25
