
Fig. 2.
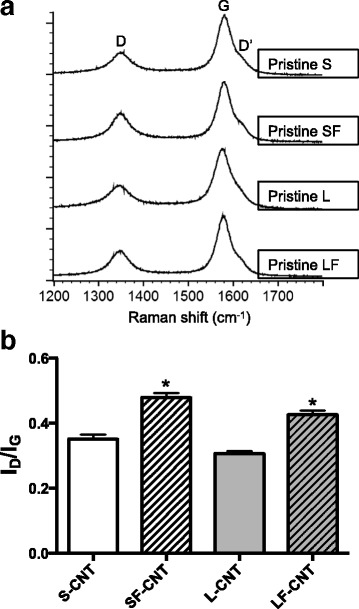
Raman spectroscopy analysis of CNT powders. Panel a Typical Raman spectra obtained on S-, SF-, L-, and LF-CNT. Panel b ID/IG ratio calculated from Raman spectra of S-, SF-, L-, and LF-CNT powders. Data are given as mean ± SEM of minimum 5 values. *: p < 0.05 vs non-functionalized counterpart. Abbreviations as in Fig. 1