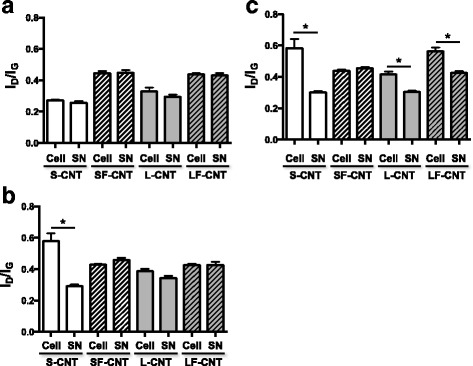
Fig. 4.

Raman spectroscopy analysis of CNT recovered from cell cultures. ID/IG ratio calculated from Raman spectra of S-, SF-, L-, or LF-CNT recovered from cellular (Cell) or supernatant (SN) fractions of RAW 264.7-exposed macrophages for 6 (Panel a), 24 (Panel b) or 48 h (Panel c). Data are given as mean ± SEM of minimum 5 values. Abbreviations as in Fig. 1. *: p < 0.05
