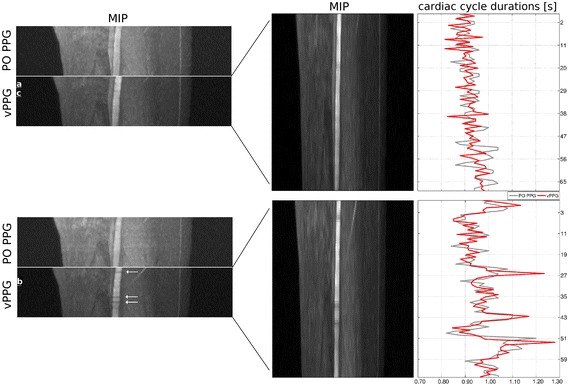
Fig. 12.

Coronal reformated MRA MIPs zoomed to the right leg of a healthy volunteer. Four MIPs consisting of 30 individual MRA images each were obtained using PO PPG and vPPG triggering. On the right side the corresponding trigger-to-trigger times between vPPG triggers (red curve) can be seen. As reference, the PO trigger-to-trigger times (gray curve) are shown as well. As can be seen, during acquisition of the second MIP, the HRV of the subject was increased. The arrows indicate short declines of the vessel signal as a result of inaccurate triggering
