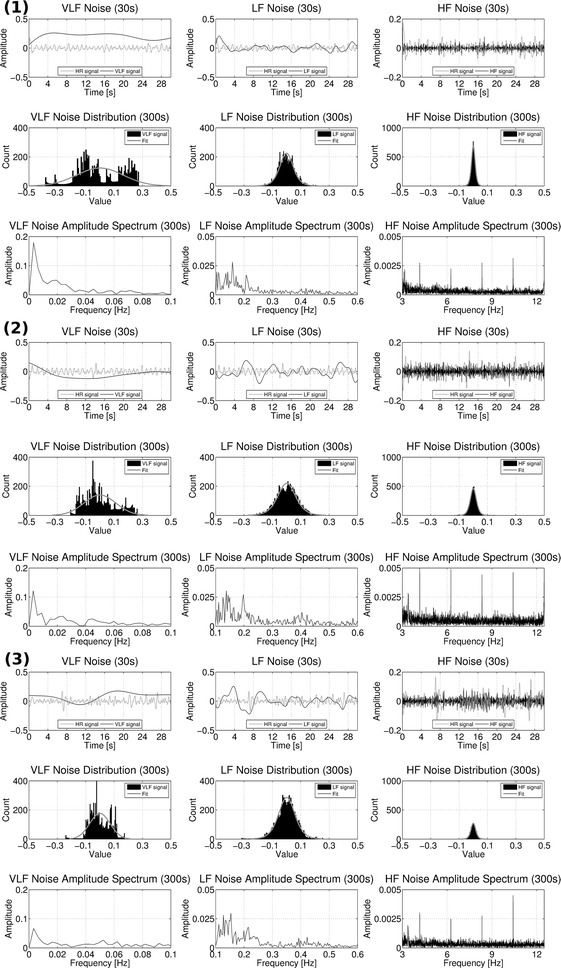
Fig. 5.

Characteristics of VLF, LF and HF noise. Shown here are all results from one subject obtained during stages (1) outside the MRI bore, (2) inside the MRI bore without imaging, and (3) inside the MRI bore with imaging. Inside each section, the first row shows 30 s of VLF, LF, and HF noise extracted from the vPPG signal. As reference, the cardiac component of the vPPG signal is shown in gray color. The second and third row show the histograms and one-sided Fourier spectra from the entire signal with a duration of 5 min
