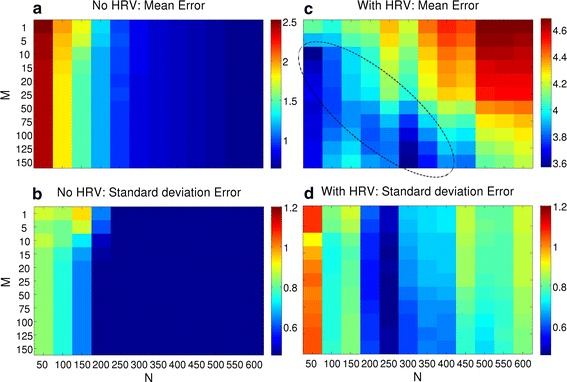
Fig. 7.

Algorithms performance on both types of synthetic vPPG signals. Results of the synthetic signals without (left) and with HRV (right) are shown in column, respectively. The first row a, c shows the mean error, while the second row b, d shows sd. For each synthetic signal, computed trigger times were compared to ground truth by absolute differences and the averaged error was stored. After processing all signals, the mean (a, c) and sd (b, d) of the individual errors was stored in the matrix. A minimum valley is highlighted in c. Values are displayed in unit samples
