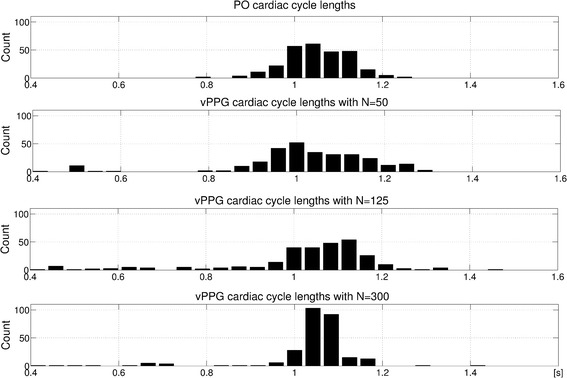
Fig. 8.

Histograms of cardiac cycle durations between subsequent triggers. The corresponding video has been obtained during stage (1). As can be seen, the algorithm produces a histogram which is too wide for N = 50, i.e. there are many too long/short cardiac cycle durations, and a histogram which is too narrow for N = 300, i.e. the cardiac cycle durations are averaged over several cardiac cycles. N = 125 results in a histogram more similar to PO
