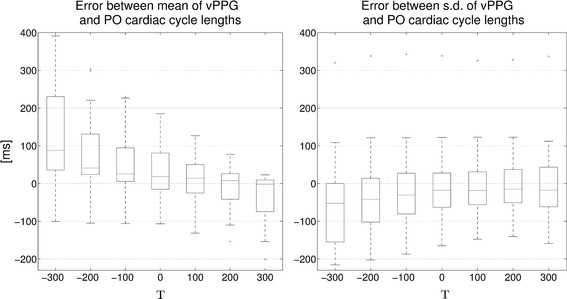
Fig. 9.

Algorithms performance with variable T. For each video, triggers were computed with the algorithm for , , and a variable T as indicated on the x-axis. For each video, the mean and sd of the durations between consecutive trigger points are computed for the vPPG and PO triggers. In the boxplots, differences between the mean and sd values of both methods are shown
