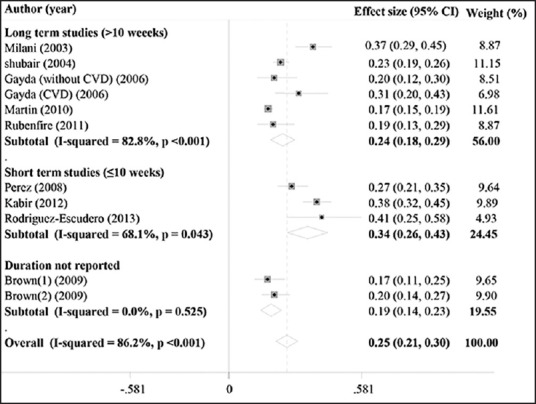
Figure 2.

Forest plot of studies that evaluated the effect of CR on the prevalence reduction of MetS and subgroup analysis based on CR duration; long-term CR (>10 weeks), short-term CR (≤10 weeks); squares and diamonds represent effect size; horizontal lines show 95% confidence intervals (CIs)
