Fig. 1.

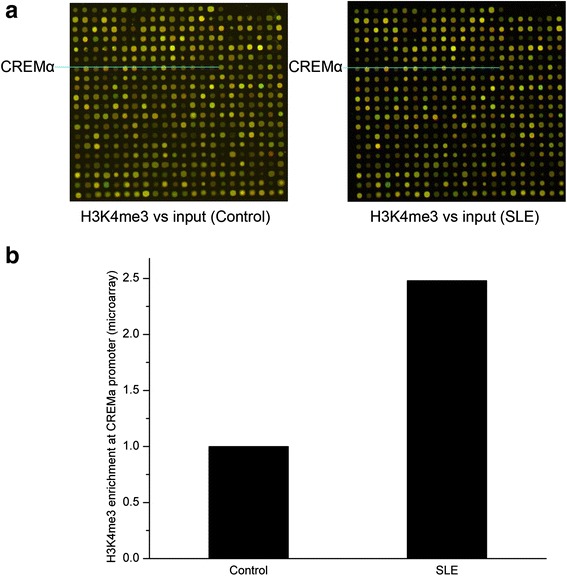
ChIP microarray analysis of H3K4me3 enrichments in SLE and control CD4+ T cells. a ChIP microarray panels showing relative H3K4me3 enrichments at various gene promoters in CD4+ T cell lysates pooled from five healthy controls (left-hand panel) and five patients with SLE (right-hand panel). Anti-H3K4me3 antibody-precipitated DNA and total DNA (input) were respectively labeled with Cy5 (red) and Cy3 (green), and samples were subsequently cohybridized onto microarray panels. Each individual dot shows the Cy3/Cy5 ratio representing relative H3K4me3 enrichment at a specific gene promoter. The CREMα promoter dot (indicated by a blue line) is located in the sixteenth column, seventh row. b Relative H3K4me3 enrichment at the CREMα promoter in SLE and control CD4+ T cells, quantified from the results shown in (a)
