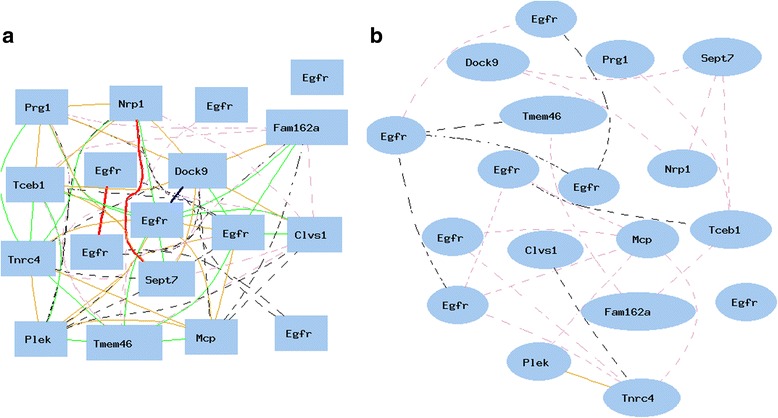
Fig. 4.

Confirmation of negative and positive correlations between Egfr and key genes showing sex difference. The 18 nodes in the graph below show the selected traits. The graph’s canvas is 40.0 by 40.0 cm, and the node labels are drawn with a 16.0 point font, and the edge labels are drawn with a 16.0 point font. Curves show Pearson correlation coefficients greater than 0.3 or less than −0.3. a. Correlations between Egfr and key genes in kidney of male mice. All nodes are displayed. The 73 edges between the nodes, filtered from the 153 total edges and drawn as curves. b. Correlations between Egfr and key genes in kidney of female mice. Lack of positive and negative correlations between Egfr probes and 11 key genes. All nodes are displayed. The 23 edges between the nodes, filtered from the 153 total edges and drawn as curves
